


Global tide - FES99
Ocean tides represent more than 80% of ocean variability. Sea level variations and consecutive currents near the coast are complicated processes; modelling pelagic and coastal tides leads to a better knowledge of this phenomena.
FES (Finite Element Solution) uses hydrodynamics computing to provide tide waves on a global scale dedicated to scientists or defence and industry communities.
Methodology is based on finite elements modelling combined with in-situ and altimetry data assimilation. Accuracy is about a few centimeters in the open ocean and a few decimeters near coastal areas.
Numerical model
Tide equation are solved on finite elements triangular grids. Unknowns (i.e slope tide velocity components) are computed on this grid.
Each grid triangular element is Lagrange P2, which means that slope is computed on the 3 vertexes and on the 3 midpoints (six nodes in total). Each velocity is computed on the 7 Gauss points. Thus we obtain interpolated velocities that we can derive to obtain node's slope. Grids are choosed to be larger on deep ocean areas and narrow on coastal areas (Le Provost et Vincent [1986] cryteria).
Finally this finite elements medel (herre called CEFMO) allow us to obtain slope values and corresponding errors on every nodes.
Datasets
Tide gauges measurements are mainly located along coasts or on islands, with a period of an hour. Altimetry data's coverage is more homegeneous on the globe, but less efficient on coastal areas, with a period of several days.
Combining this two types of observations leads to a better ocean surface coverage, from coastal areas/ continental shelfs to open ocean. This data are then assimilated in previous numerical model, using representative method.
FES99 tide waves
Representative method does not need all data (5318 crossover points in total) for the assimilation. Then a selection is made:
- no data located out of the grid
- no data located deeper than 200 meters: crossover analysis in not enough efficient there, wich is compensated by maregraphic data availability
- a minimal distance (600 kilometers, ie double of distance between two T/P tracks on equator) between crossover points, so that we don't get any oversampled points.
| Wave name | M2 | S2 | N2 | K2 | 2N2 | K1 | O1 | Q1 |
| Number of assimilated data | 1470 | 1444 | 1323 | 1343 | 237 | 1584 | 1588 | 1339 |
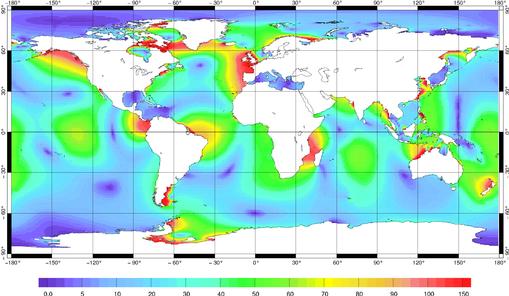
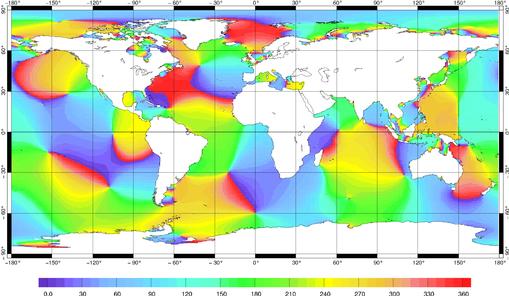
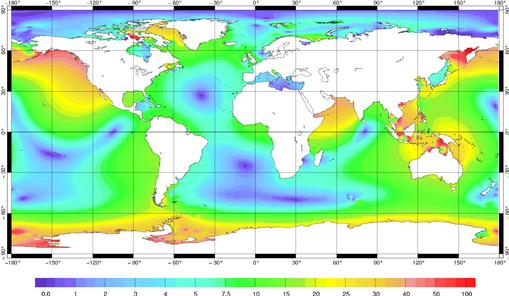
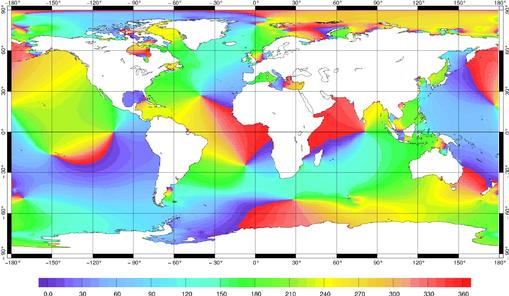
FES99 provides eight primary waves (M2, S2, N2, K2, 2N2, K1, O1 and Q1) and nineteen secondary waves (m2, n2, L2, l2,T2, e2, h2, P1, 2Q1, r1, s1, J1, c1, M11, M12, OO1, j1, p1, and q1).
Following plots show the exemple of M2 and K1 waves. M2 semi-diurnal tide is one of the largest components; it is the tide generated by the attraction of an "ideal" Moon, in a perfectly circular orbit around the Earth's equator. K1 diurnal tide reflects variations in the declination of the Sun and Moon.
- See also FES99 bibliography.
Data
- Products guide.
 Products .
- Sea surface height products .
- Value-added products .
- Wind/wave products .
- Auxiliary products .
- MSS .
- MDT .
- Global tide - FES .
- Description FES2014.
- Description FES2012.
- Description FES2004.
- Description FES99.
- Coastal Tide - XTRACK .
- Internal tide - MIOST.
- Dynamic Atmospheric Correction dedicated to SWOT CalVal Phase .
- Dynamic Atmospheric Correction .
- Wet troposphere correction from water vapour climate data records.
- GPD+ Wet Tropospheric Correction.
- References.
- Ice products .
- Ocean indicators products .
- Ocean data challenges .
- In-situ products .
- Data access .
- Tools .
- Product information .
- CALVAL .
- Operational information .