


Altimeters-interferometers
The altimetry interferometric technique relies on the measurement of the relative delay between observations of a same ground given point observed from two slightly different positions (from two antennas separate with a mast in the case of SWOT). This relative delay expresses a slant range difference that can be interpreted as a geo-localised height measurement.
The main limitations of standard nadir-pointing radar altimeters have been understood for a long time. They include the lack of coverage (intertrack distance of typically 150 km for the T/P / Jason tandem) and the spatial resolution (typically 2 km for T/P and Jason), expected to be a limiting factor for the determination of mesoscale phenomena in the deep ocean. In this context, various solutions using off-nadir radar interferometry have been proposed to provide higher resolution objectives. An initial approach was based on the Wide-Swath Ocean Altimeter (WSOA) which was intended to be implemented onboard Jason-2 but has been abandoned. Swot will integrate this new interferometric altimetric technique. Planned from 2021, it will be the first satellite to address both ocean and hydrology objectives.
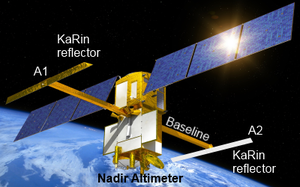
Swot : nadir and off-nadir altimeters
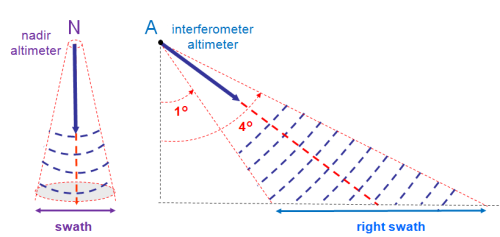
The SWOT satellite includes two kind of altimeters: a dual-frequency (C and Ku-band) conventional altimeter which is only available for the nadir point over a ground footprint of 5-10 km.
The second altimeter is the core instrument: a Ka-band radar Interferometer (KaRin). KaRin contains two Ka-band SAR antennae at opposite ends of a 10-meter boom (A1 and A2 on the figure) which forms the interferometric baseline (B on the figure). The interferometric is a dual-swath system, alternatively illuminating the left and right swaths on each side of the nadir track. These two swaths measure 50 km wide in a 1°-4° plan.
The altimeter KaRIn operates in a « Non Ping-Pong mode », also called bistatic mode : one of the antennas transmits and both receive the radar echoes. The following figure details this operation (display the red and blue frames by moving the mouse over the figure):
|
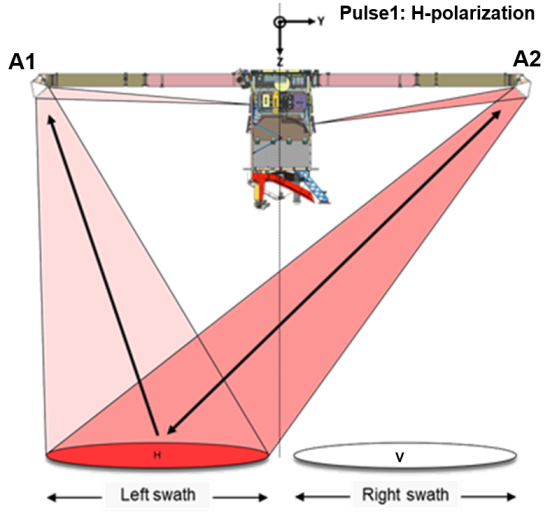
Illustration of the Non Ping Pong mode on SWOT. Display the red and blue frames by moving the mouse over the figure. Credits NASA/JPL, CNES. |
The interferometric measurement concept
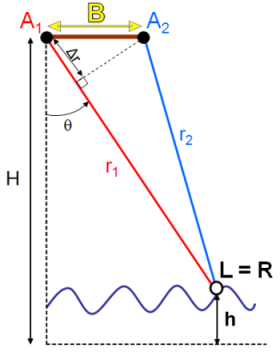
On a schematic 2D view and for a given point on the ground, a triangle is thus formed, by the baseline B, and the range distance to the two antennas (r1 and r2). See figure on the right. The topographic height measurement is deduced from:
- first, the range distance r1 is determined using the round-trip time between the satellite and the surface as for conventional altimetry,
- in non ping-pong mode, the interferometric phase difference Δφ between the two signals r1 and r2 is given by : Δφ = -2π/λ (r2-r1). Many multiples r2 values are possible for a given Δφ. To remove this ambiguity, the phase must be unwrapped before estimating topography.
- this phase difference Δφ helps to determine the look angle (θ) by the following equation: Δφ = kB sin (θ) (where k is the electromagnetic wavenumber related to the radar wavelength),
- Once the looking angle is determined by this previous equation, the height can be computed:
h= H – r1 cos (θ).
In the case of the low resolution mode, the KaRIn onboard processor generates the interferograms and a 250mx250m averaging onboard before measurements being downlinked to the ground. Then, the heights are estimated during the ground processing. In the High Resolution mode, all raw measurements are downlinked to the ground. Thus, the interferometric altimetry enables to give a horizontal resolution of 250 m x 250 m over ocean and about 5m (along-track) x 10-70 m over land.
The interferometric measurement concept is basically triangulation where the baseline B forms the base. H represents the altitude of the satellite relative to an arbitrary reference surface, h is the surface height that we want to determine (relative to the same reference surface). L and R is the same ground point that re-emits the backscattered signal toward the left and right swath by the r1 and r2 distances. Θ represents the look angle.
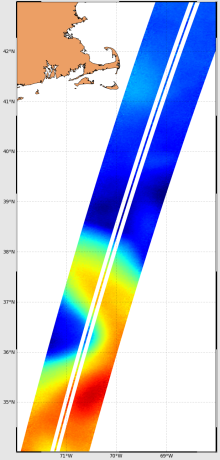
Example of SWOT simulated data over ocean
Example of SWOT simulated data from the MIT-Global Circulation Model sampled by the JPL simulator. The data represent the Absolute Sea Surface Height (in cm) over the Gulf Stream area. This animation (top) integrates two cycles of 21 days so a total time lapse of 42 days. The contiguous ground tracks can be separated by several days in time, explaining the topography discontinuities looking like a patchwork. Products to end-users will integrate more processing like dynamic optimal interpolation in order to fill in temporal gaps and to have a continuous reconstruction. The zoomed map (right) shows only one ground track highlighting the left/righ swaths from KaRin altimeter and the track in the middle from the nadir altimeter, off Cape Cod. Credit CNES/CLS - MIT/GCM - JPL. |
 |
Further information:
- Links and references on SWOT
- J.C Souyris, OSTST 2010, Upcoming altimeter measurments: explaining interferometric SAR, pdf
- Newsletter #10, 2004 : Observing the Ocean with a Wide-Swath Altimeter, L-L. Fu and al. (pdf, 1.3 Mo).