

Credits CLS/CNES
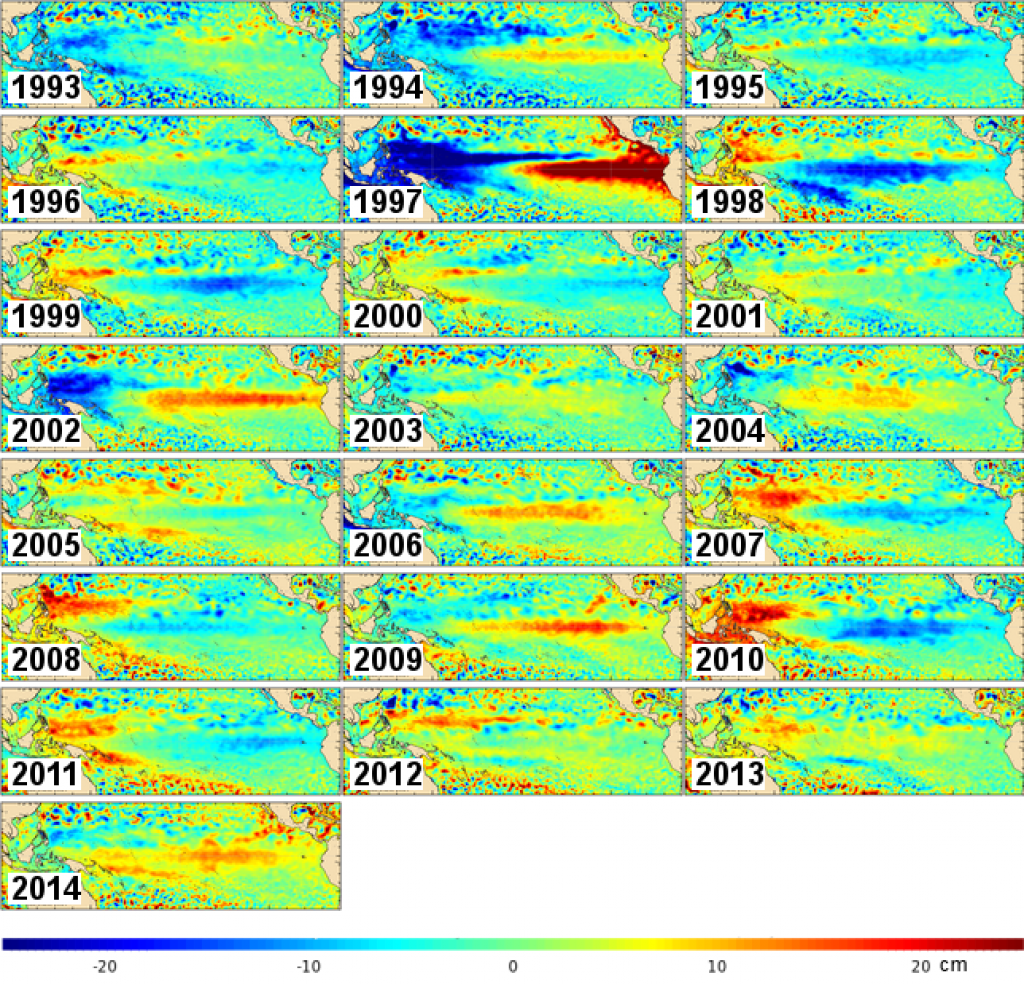
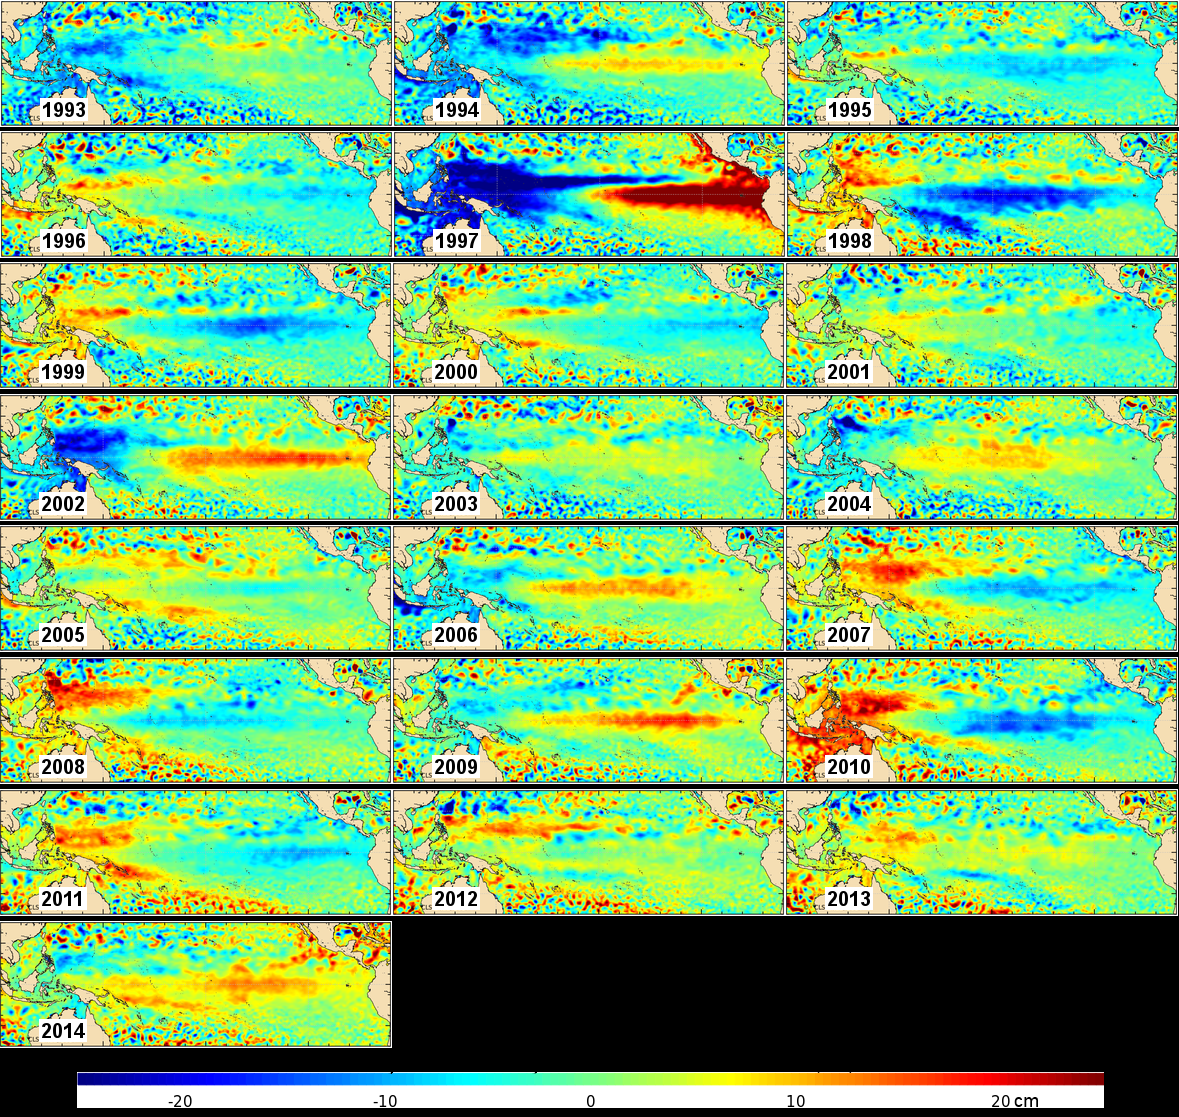
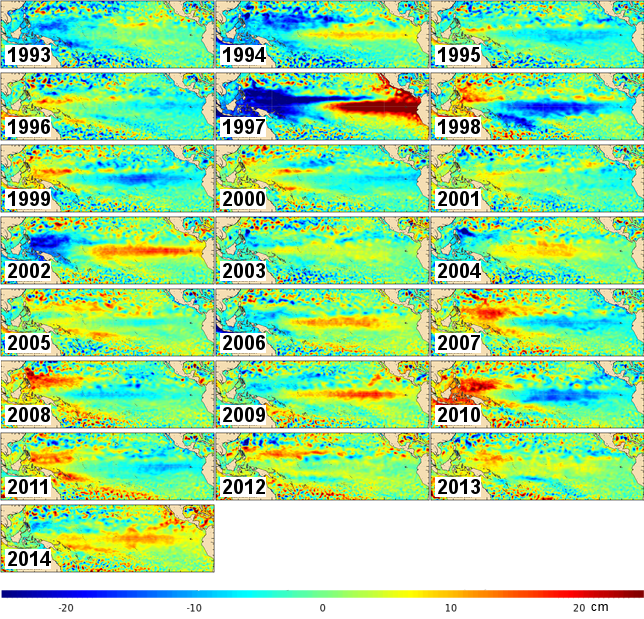
El Niño / La Niña: Maps of Sea Level Anomalies on Novembers each year since 1993
Monthly averages maps of Sea Level Anomalies (in cm) on Novembers each years since 1993, over the Equatorial Pacific from the El Niño Bulletin. The time series of the standardized Sea Level Anomalies is also displayed and updated on the Indicator page.
Downloads
| File | Type | Size | Lang | Resolution | Creation date | Represented date |
|---|---|---|---|---|---|---|
| Msla_MoyMens_PacTrop_1993_2014.png | Image | 2.18Mb | 1179x1117 | 2015-08-19 | ||
| Msla_MoyMens_PacTrop_1993_2014_sm.png | Image | 735.88kb | 644x619 | 2015-08-19 |
- Geographic area : Pacific Ocean
- Instrument : Altimeter
- Parameter : Sea level anomalies
- Topic : El Niño