

Credits CLS/CNES
Animation El Niño 2015
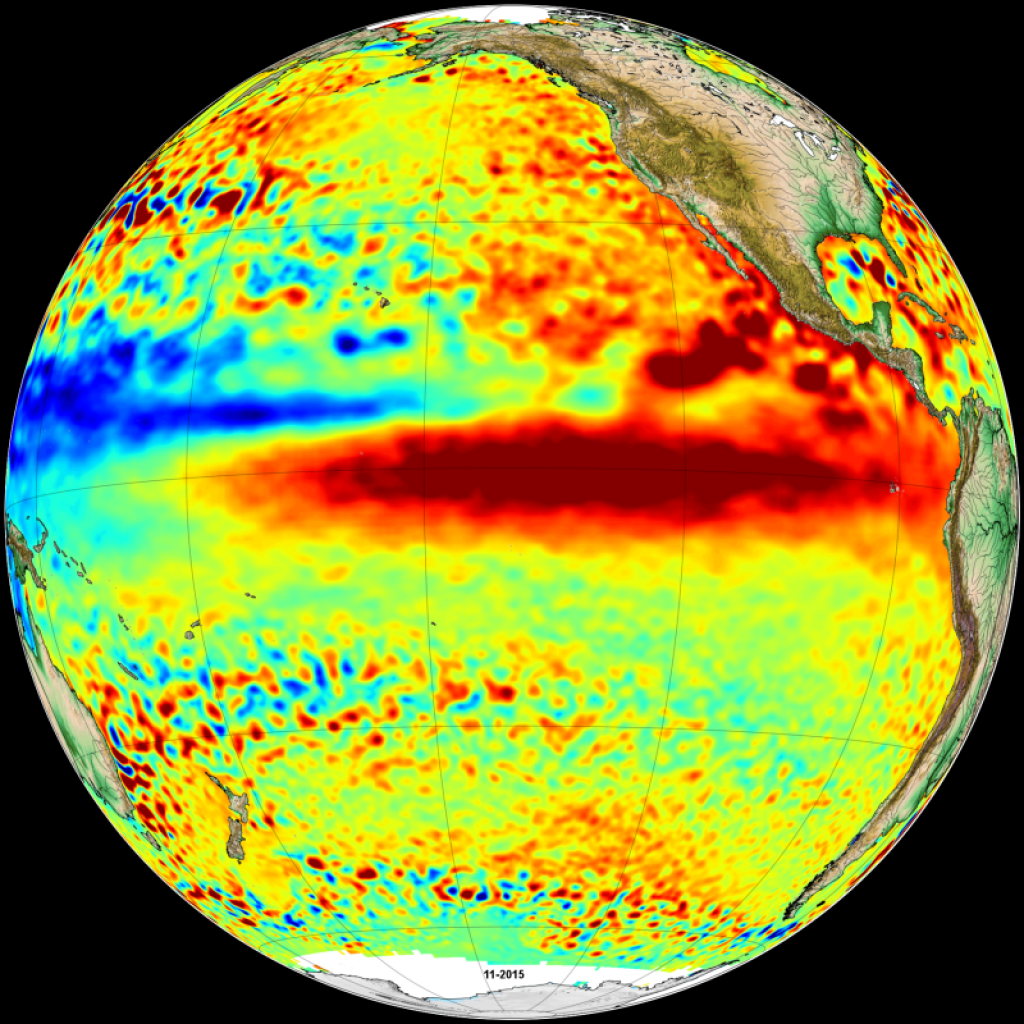
Animation with weekly maps of Ssalto/Duacs Sea Level Anomalies from September 2014 to September 2015 (and December 2015 for the latest version), annual and seasonnal cycles removed (several frame rates are proposed).
Altimeter satellites tracked the development of El Niño, highlighting large areas across the equatorial Pacific with above average (more than 20 cm in April 2014). Sea Surface Temperature were also above-average on May 2015 and strengthenes across the east-central Pacific during summer.
Those conditions were as high as observed during 1987 El-Niño, and thus forecasts are close to that episode.
By keeping in mind, the last years when El Niño aborted, the 2015 event is examined in detail and particularly the atmospheric features.
During July 2015, easterly winds were weaker than normal. The ocean-atmosphere coupling was in place: El Niño conditions are present.
On August 2015, anomalies of sea surface temperatures in the equatorial Pacific Ocean are above average of +2°C.
The anomaly of sea surface temperatures in the equatorial Pacific Ocean was still above average up to November 2015. This 2015 event is a strong event. If this anomaly persisted during next months, a very strong event would be reached.
Downloads
| File | Type | Size | Lang | Resolution | Creation date | Represented date |
|---|---|---|---|---|---|---|
| globe_monthly_ENSO_201511.png | Image | 934.47kb | 800x800 | 2015-12-01 | 2015-11-15 | |
| globe_monthly_ENSO_201409_201512_2f.mp4 | Video | 7.51Mb | 2016-01-01 |
- Geographic area : Pacific Ocean
- Instrument : Altimeter
- Parameter : Sea level anomalies
- Topic : El Niño
- Satellite : Multimission