

Credits CNES/EU Copernicus Marine Service
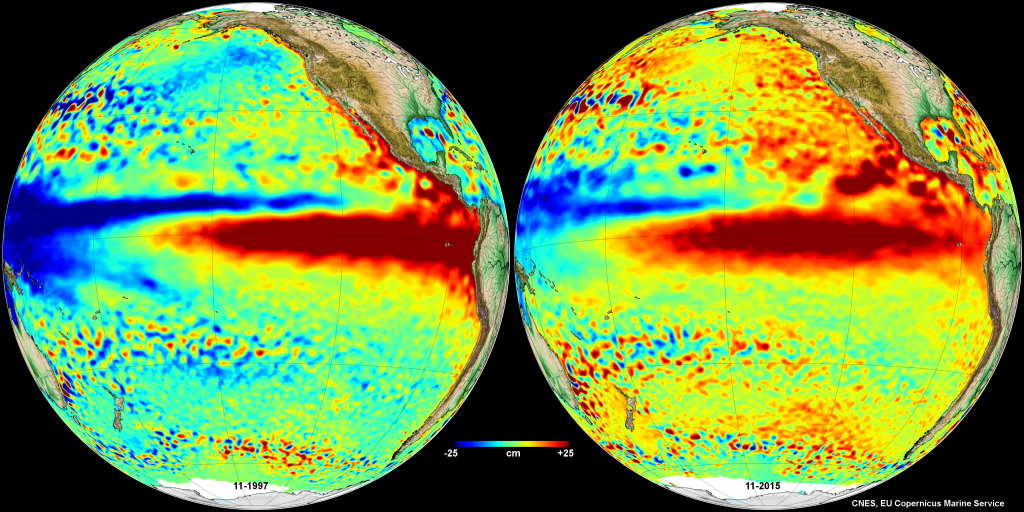
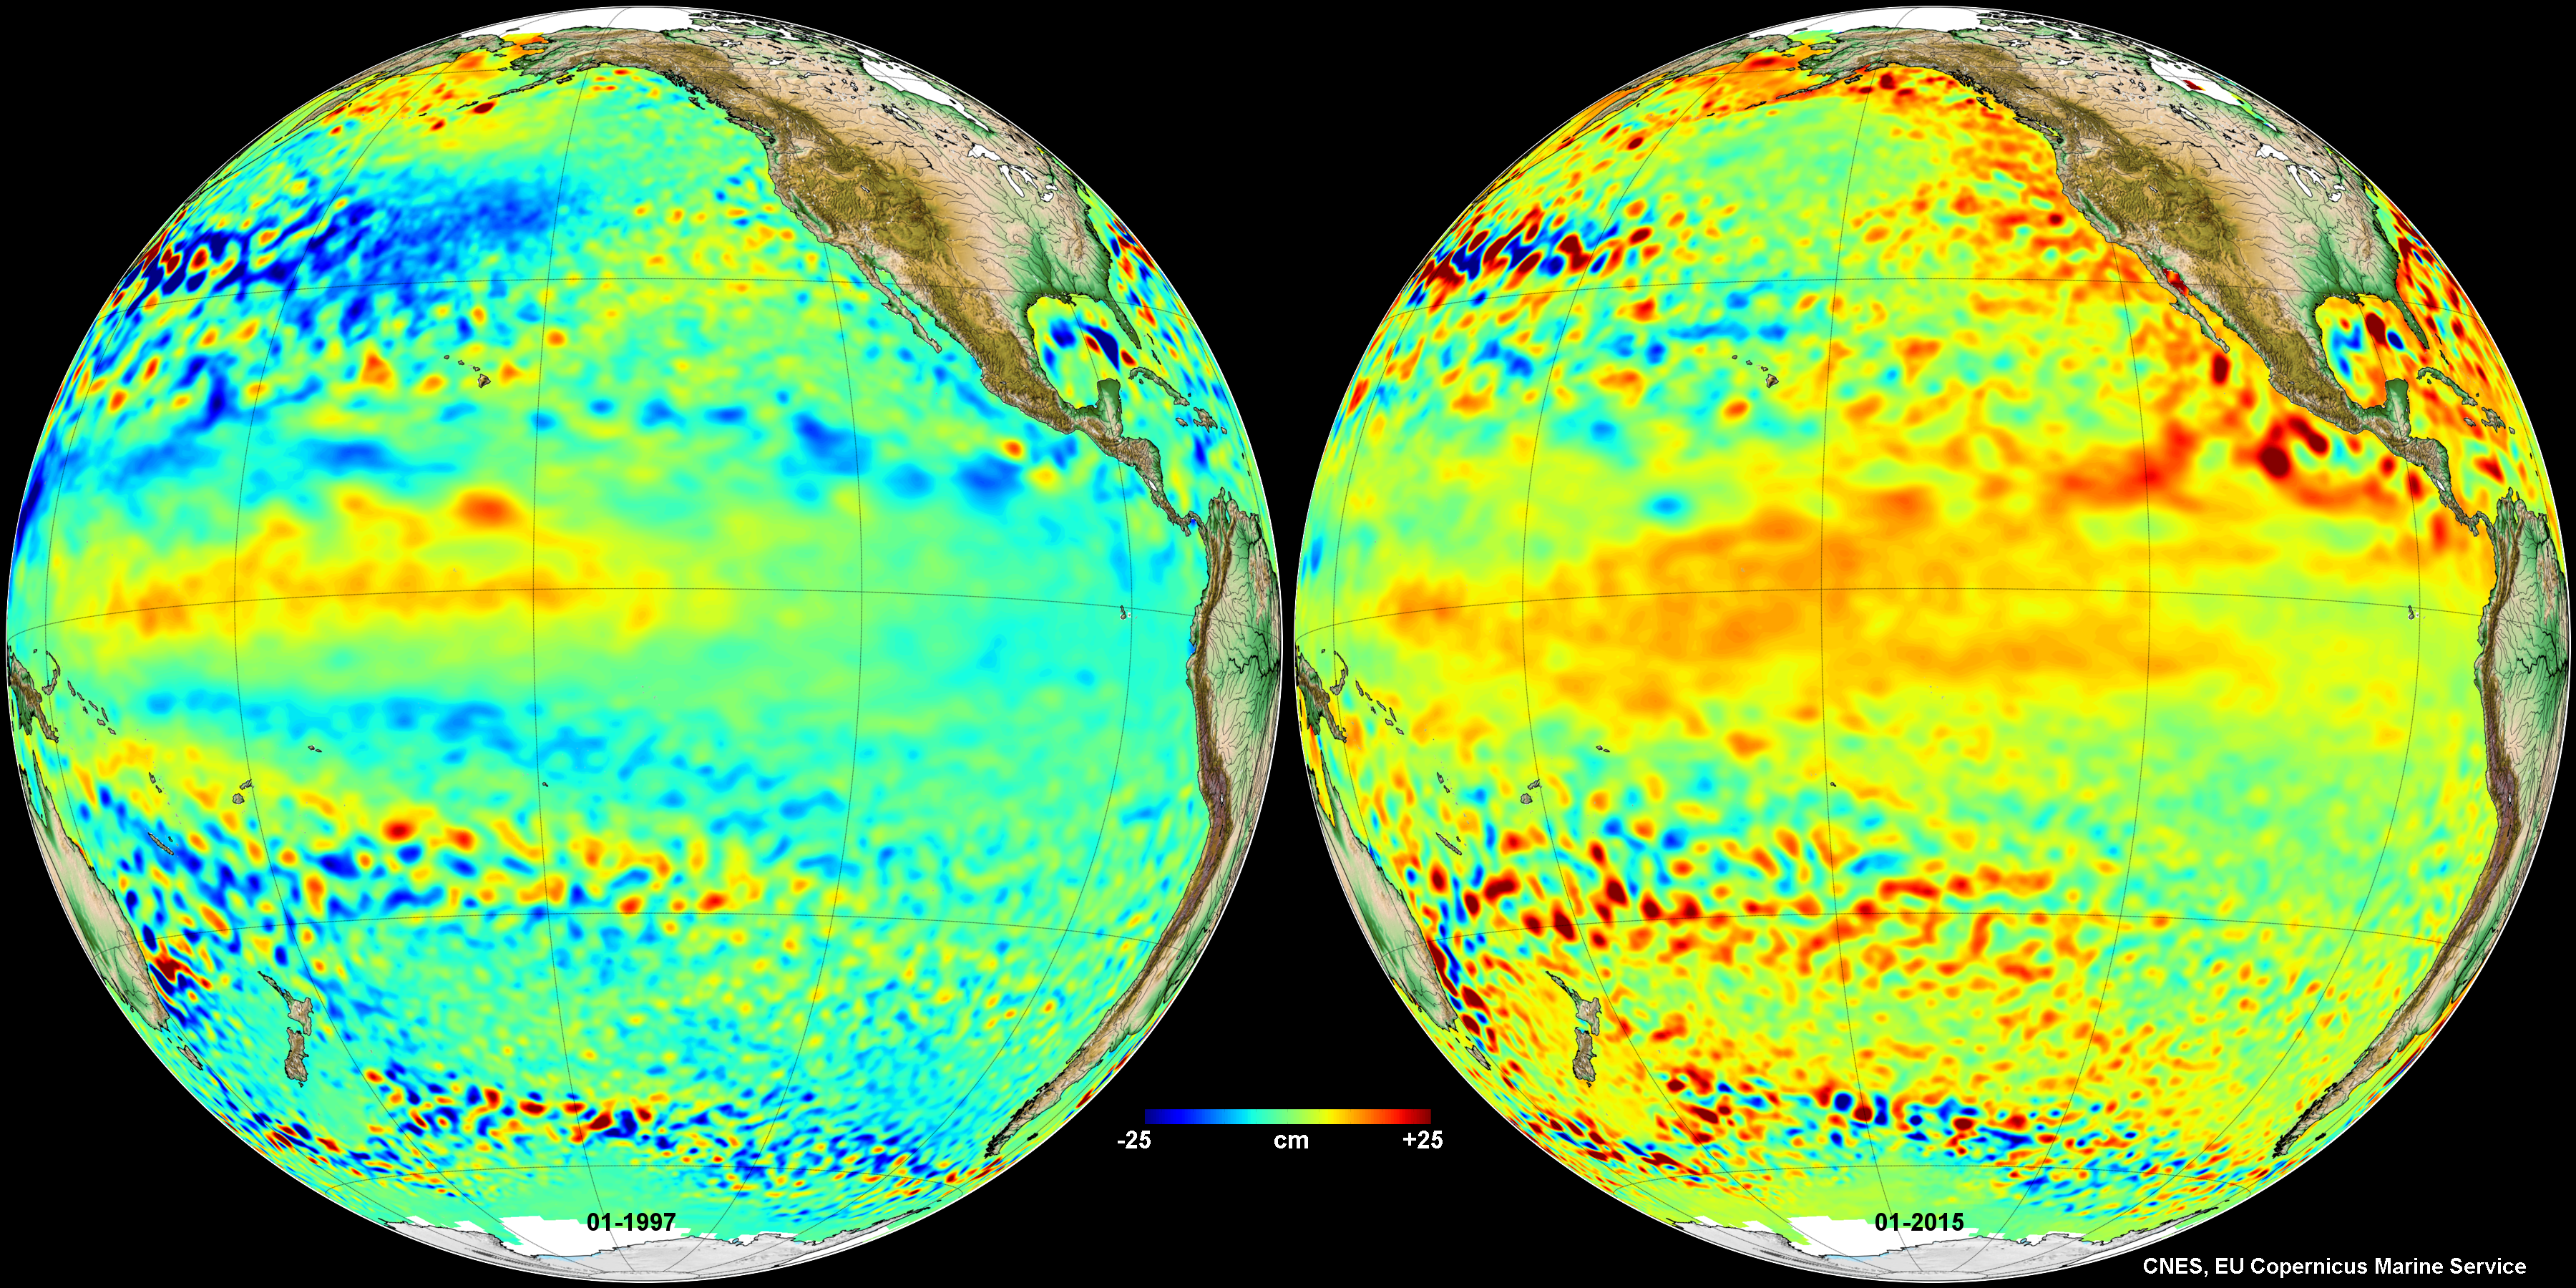
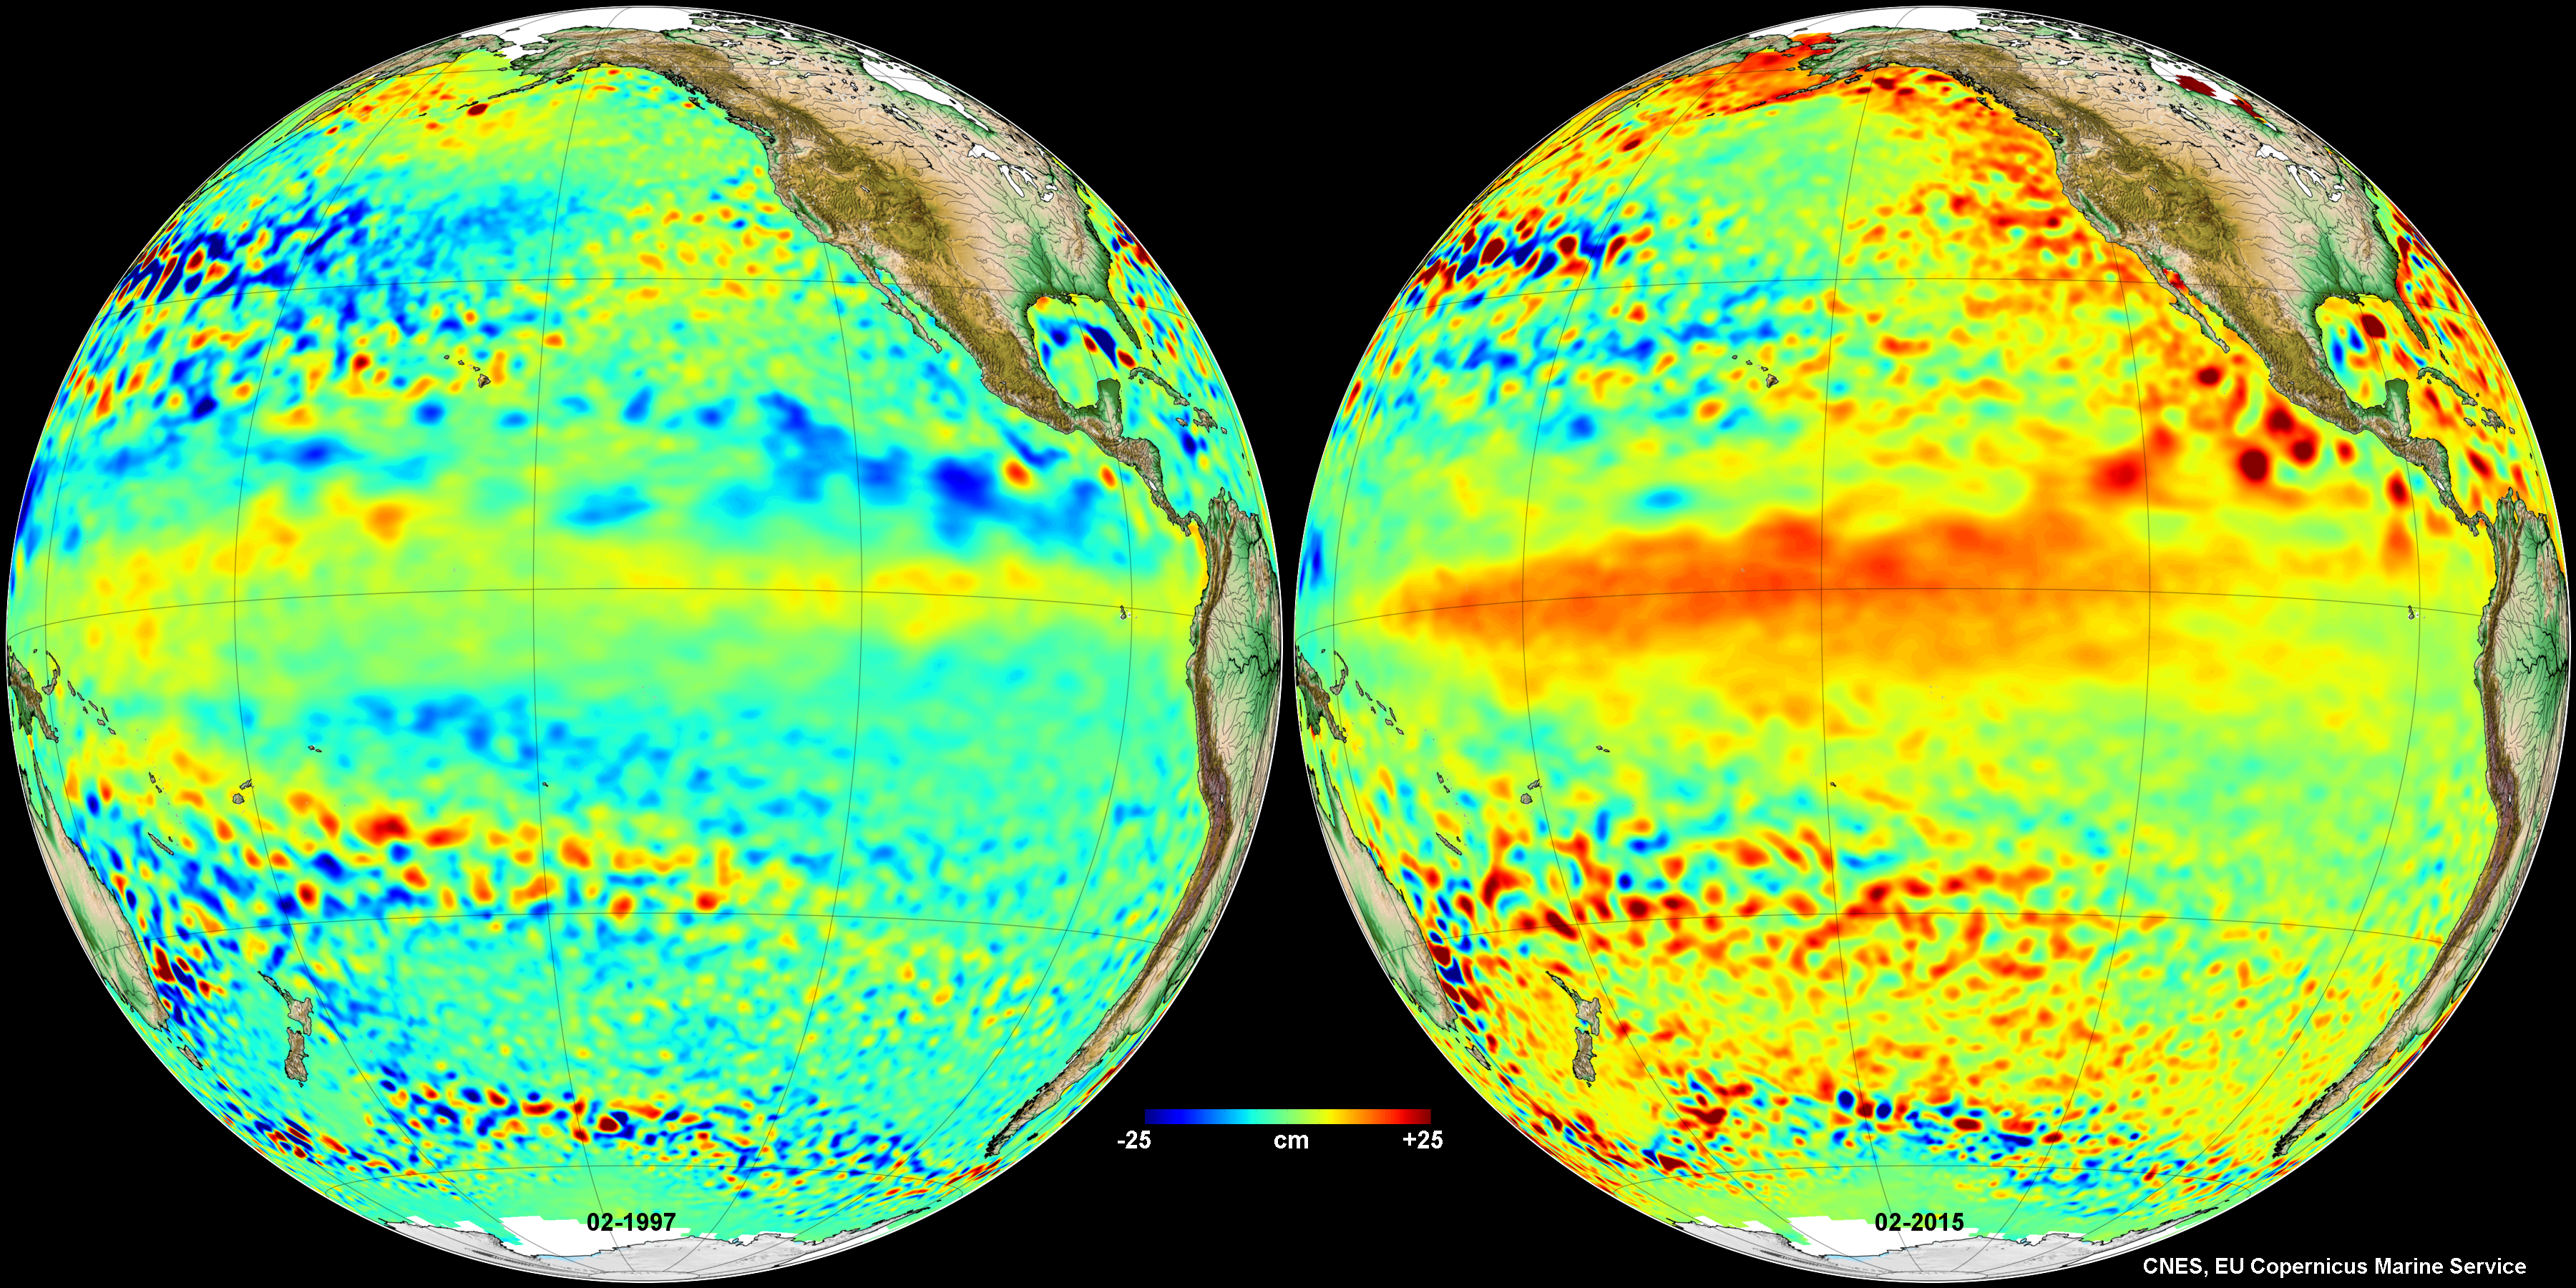
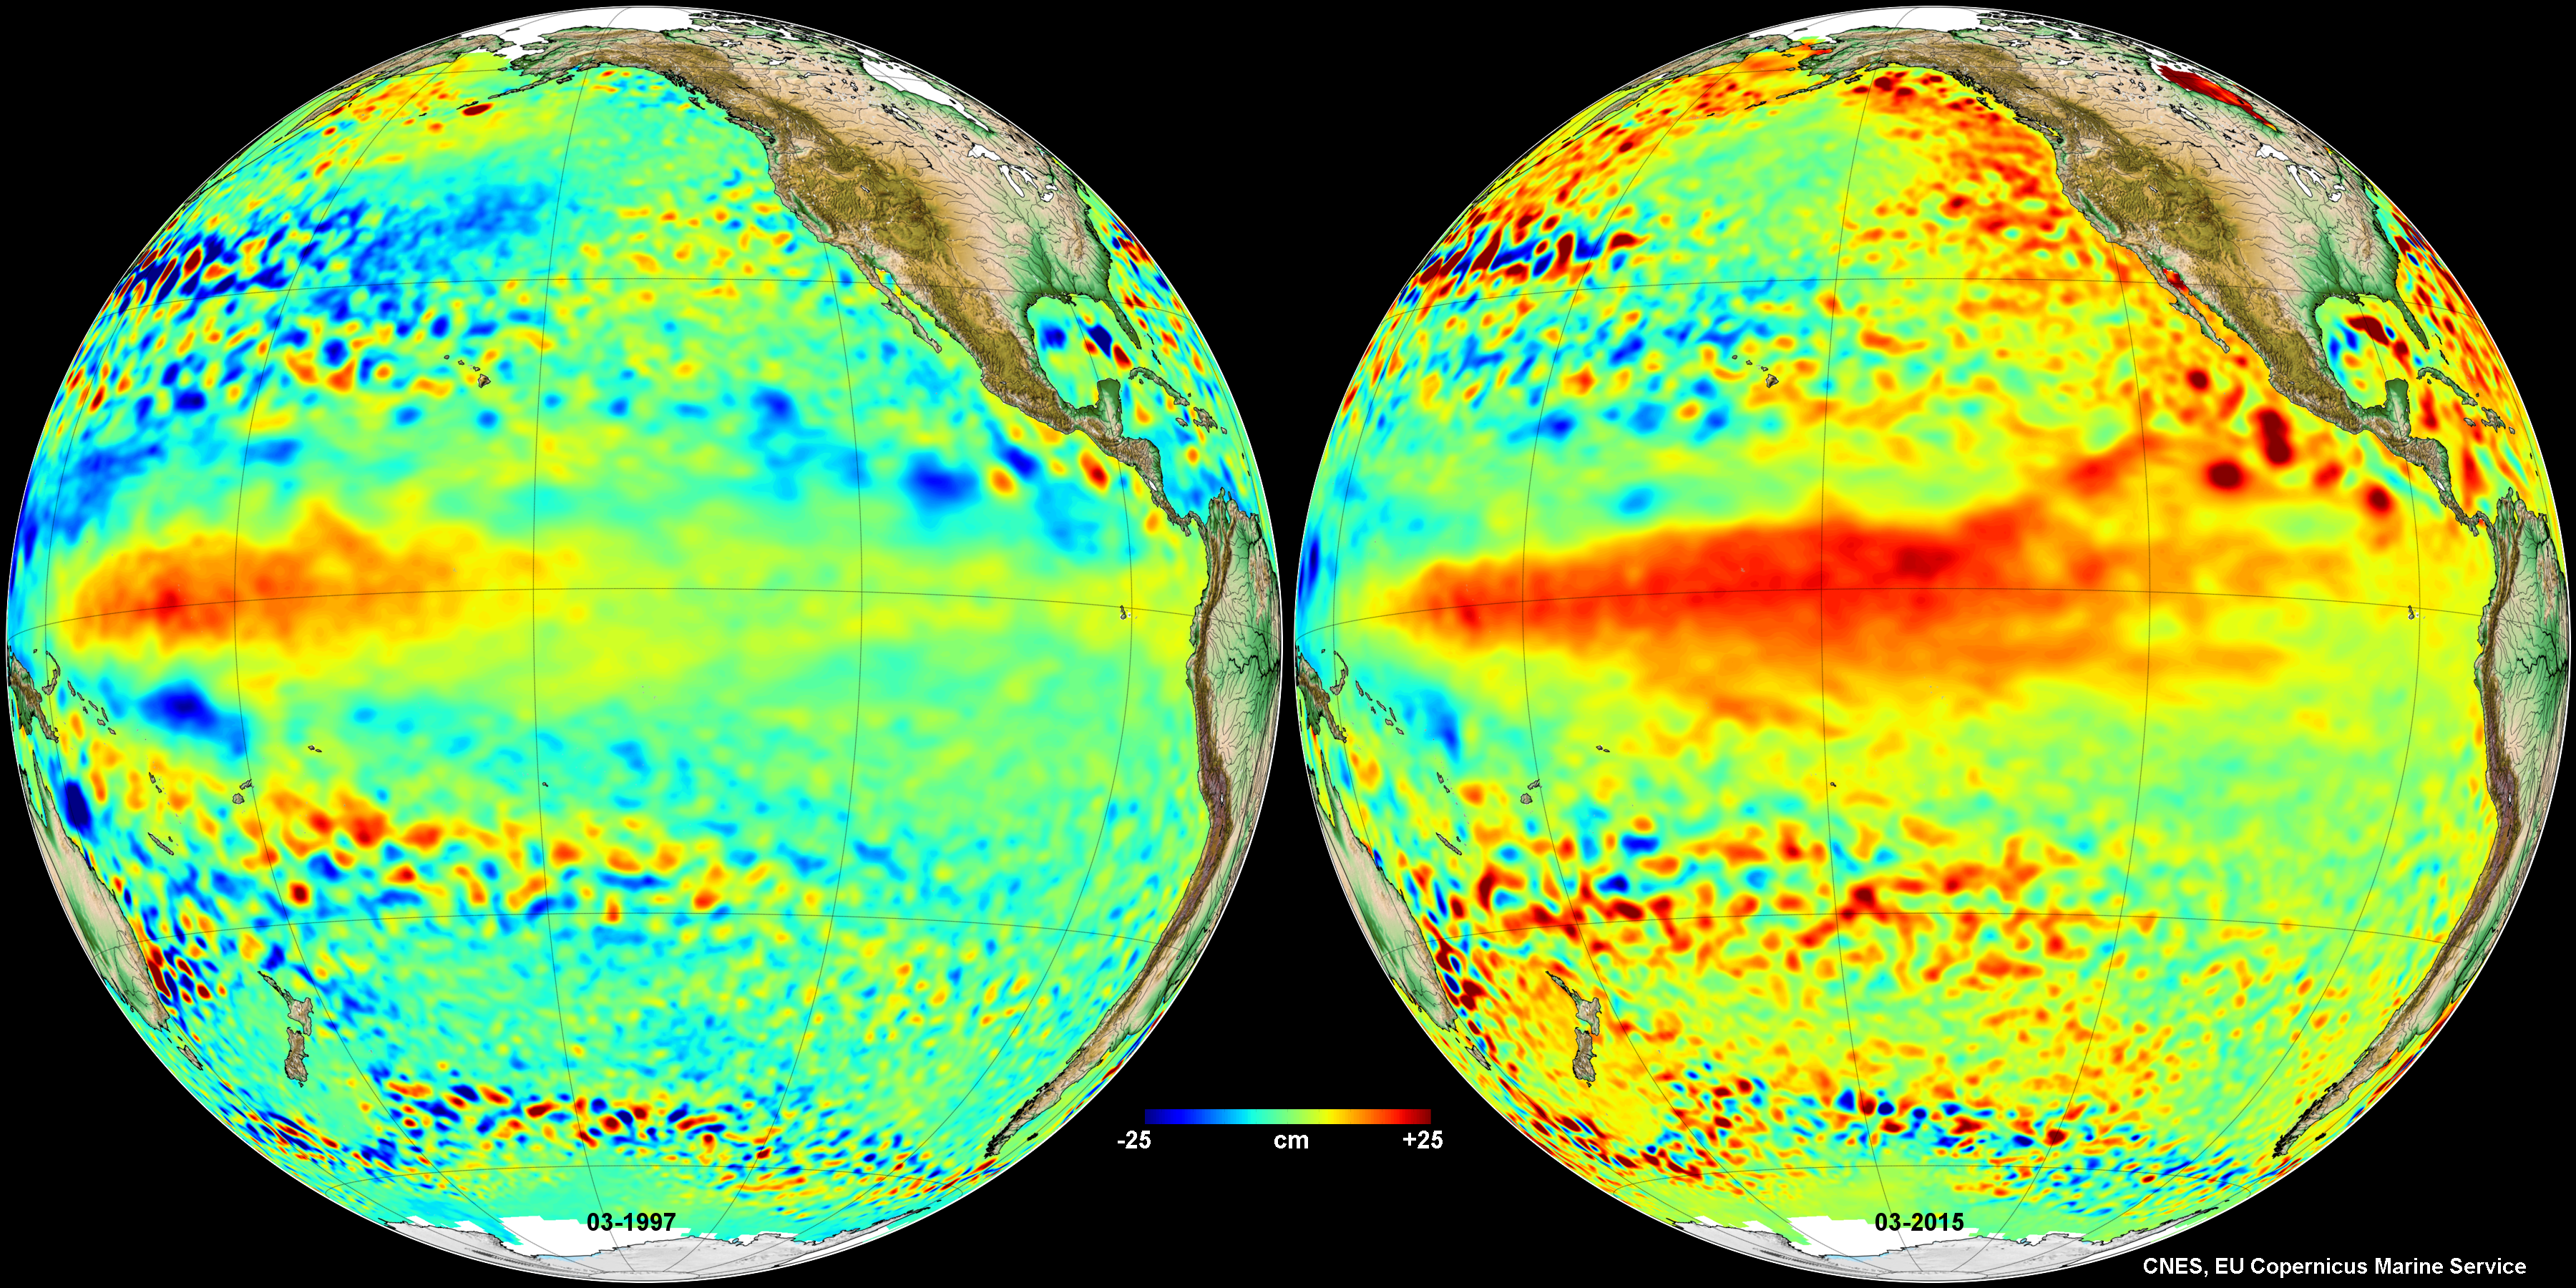
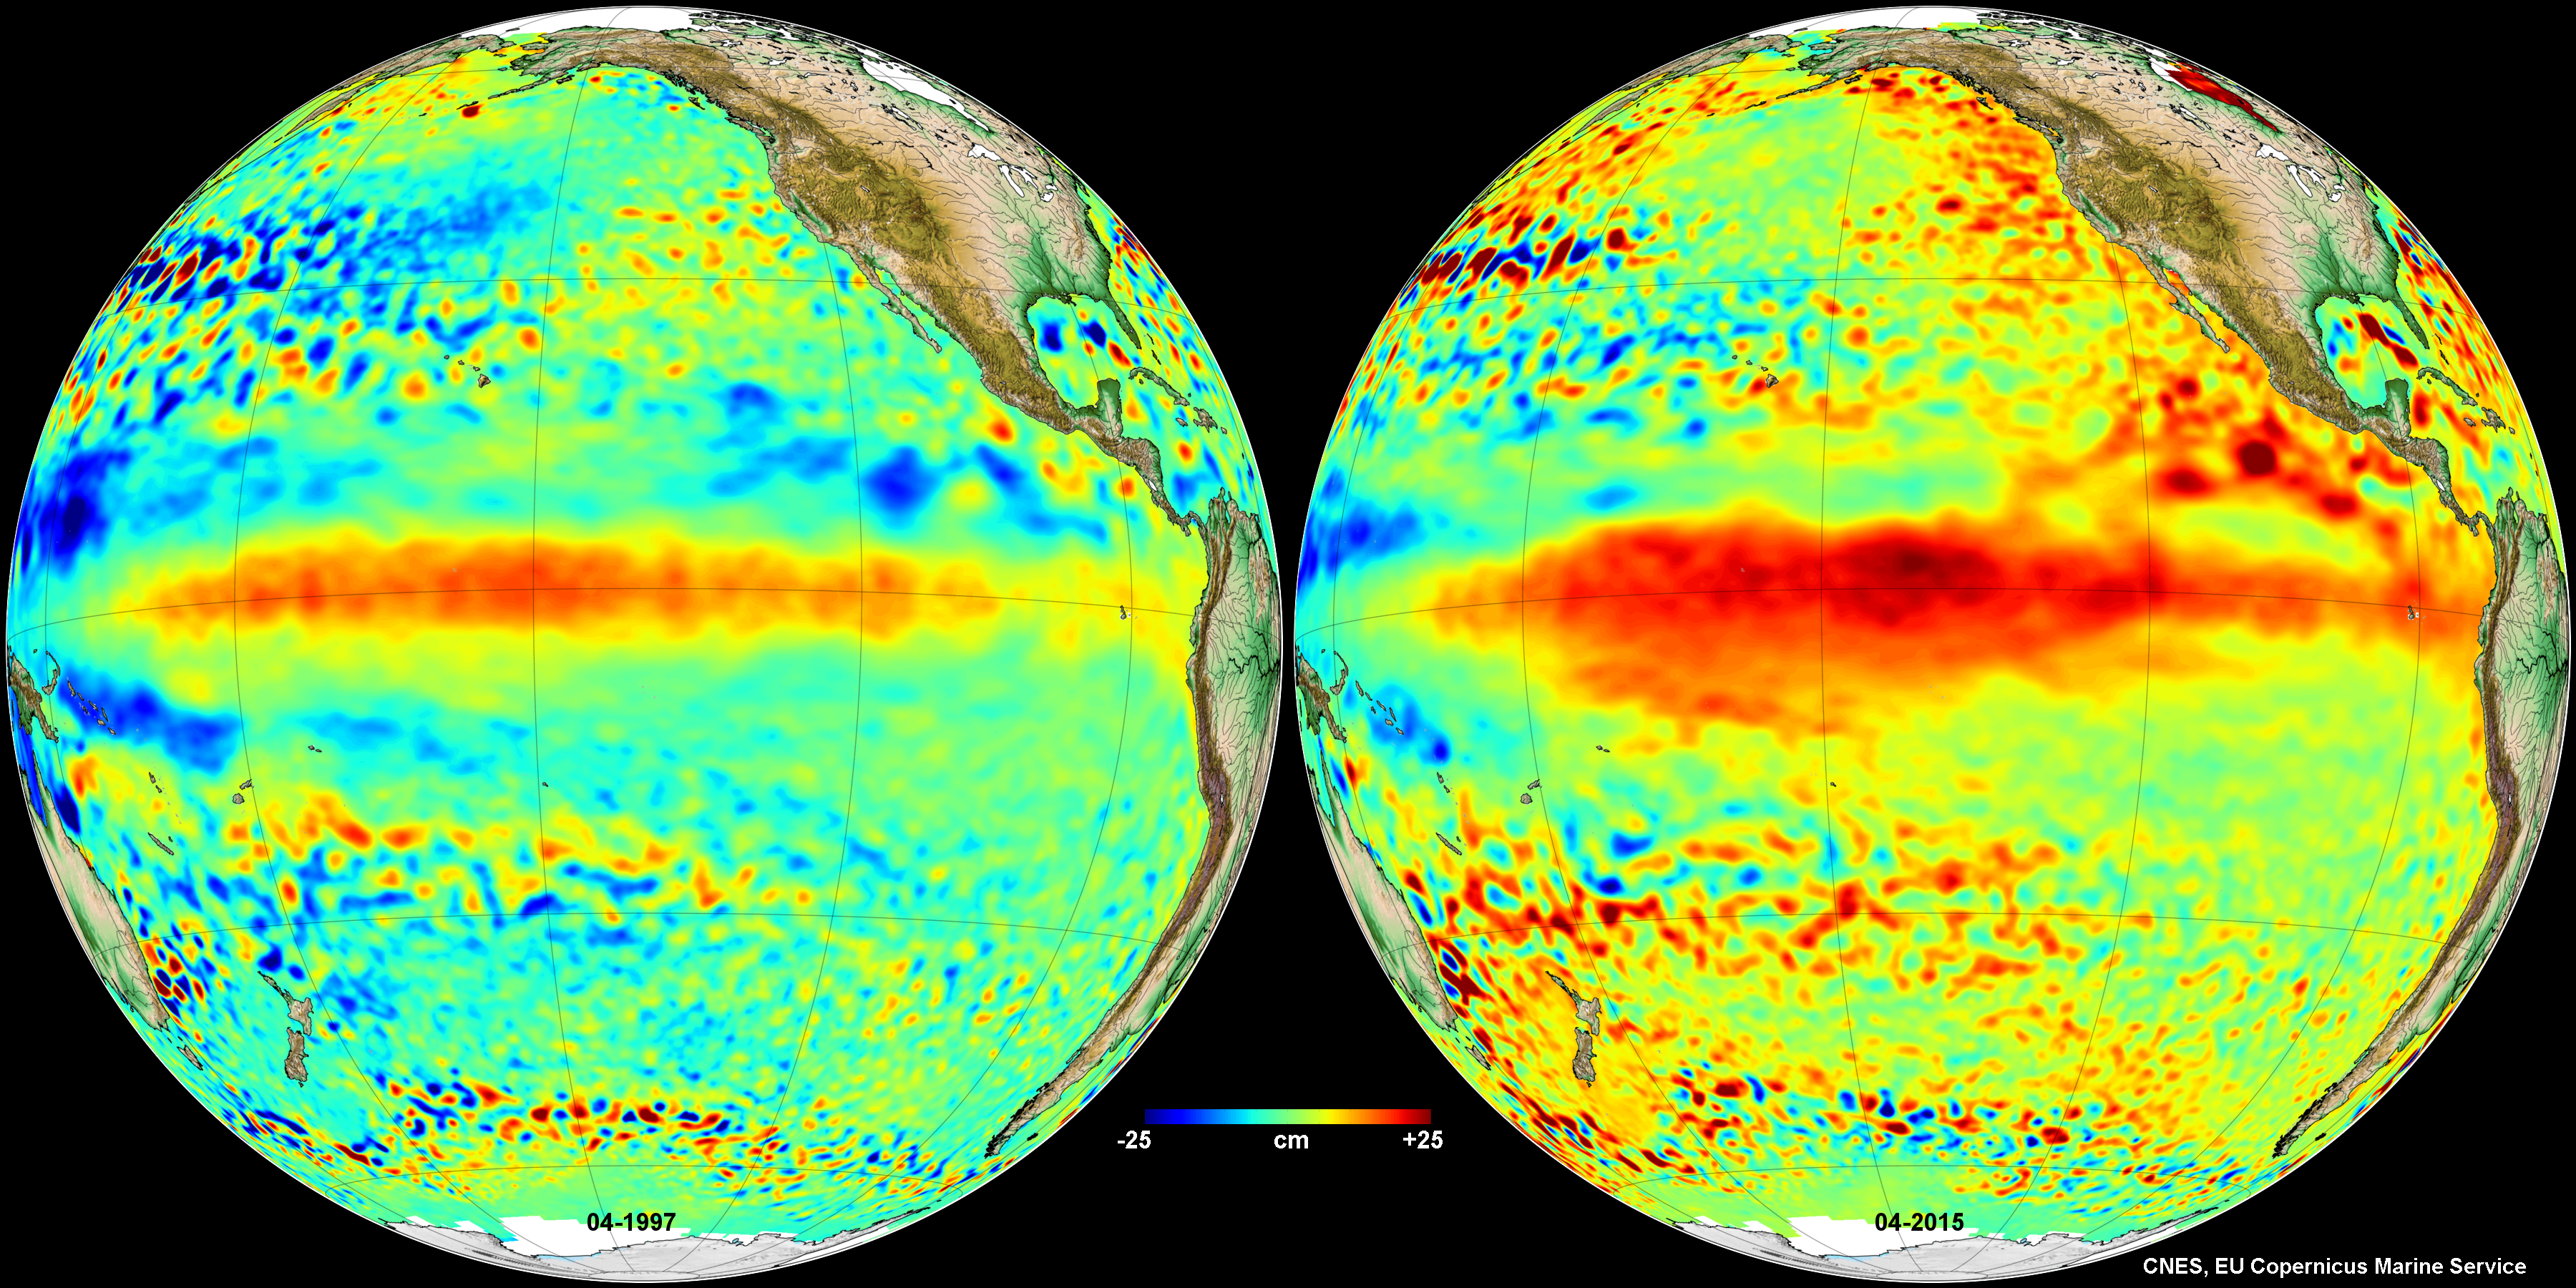
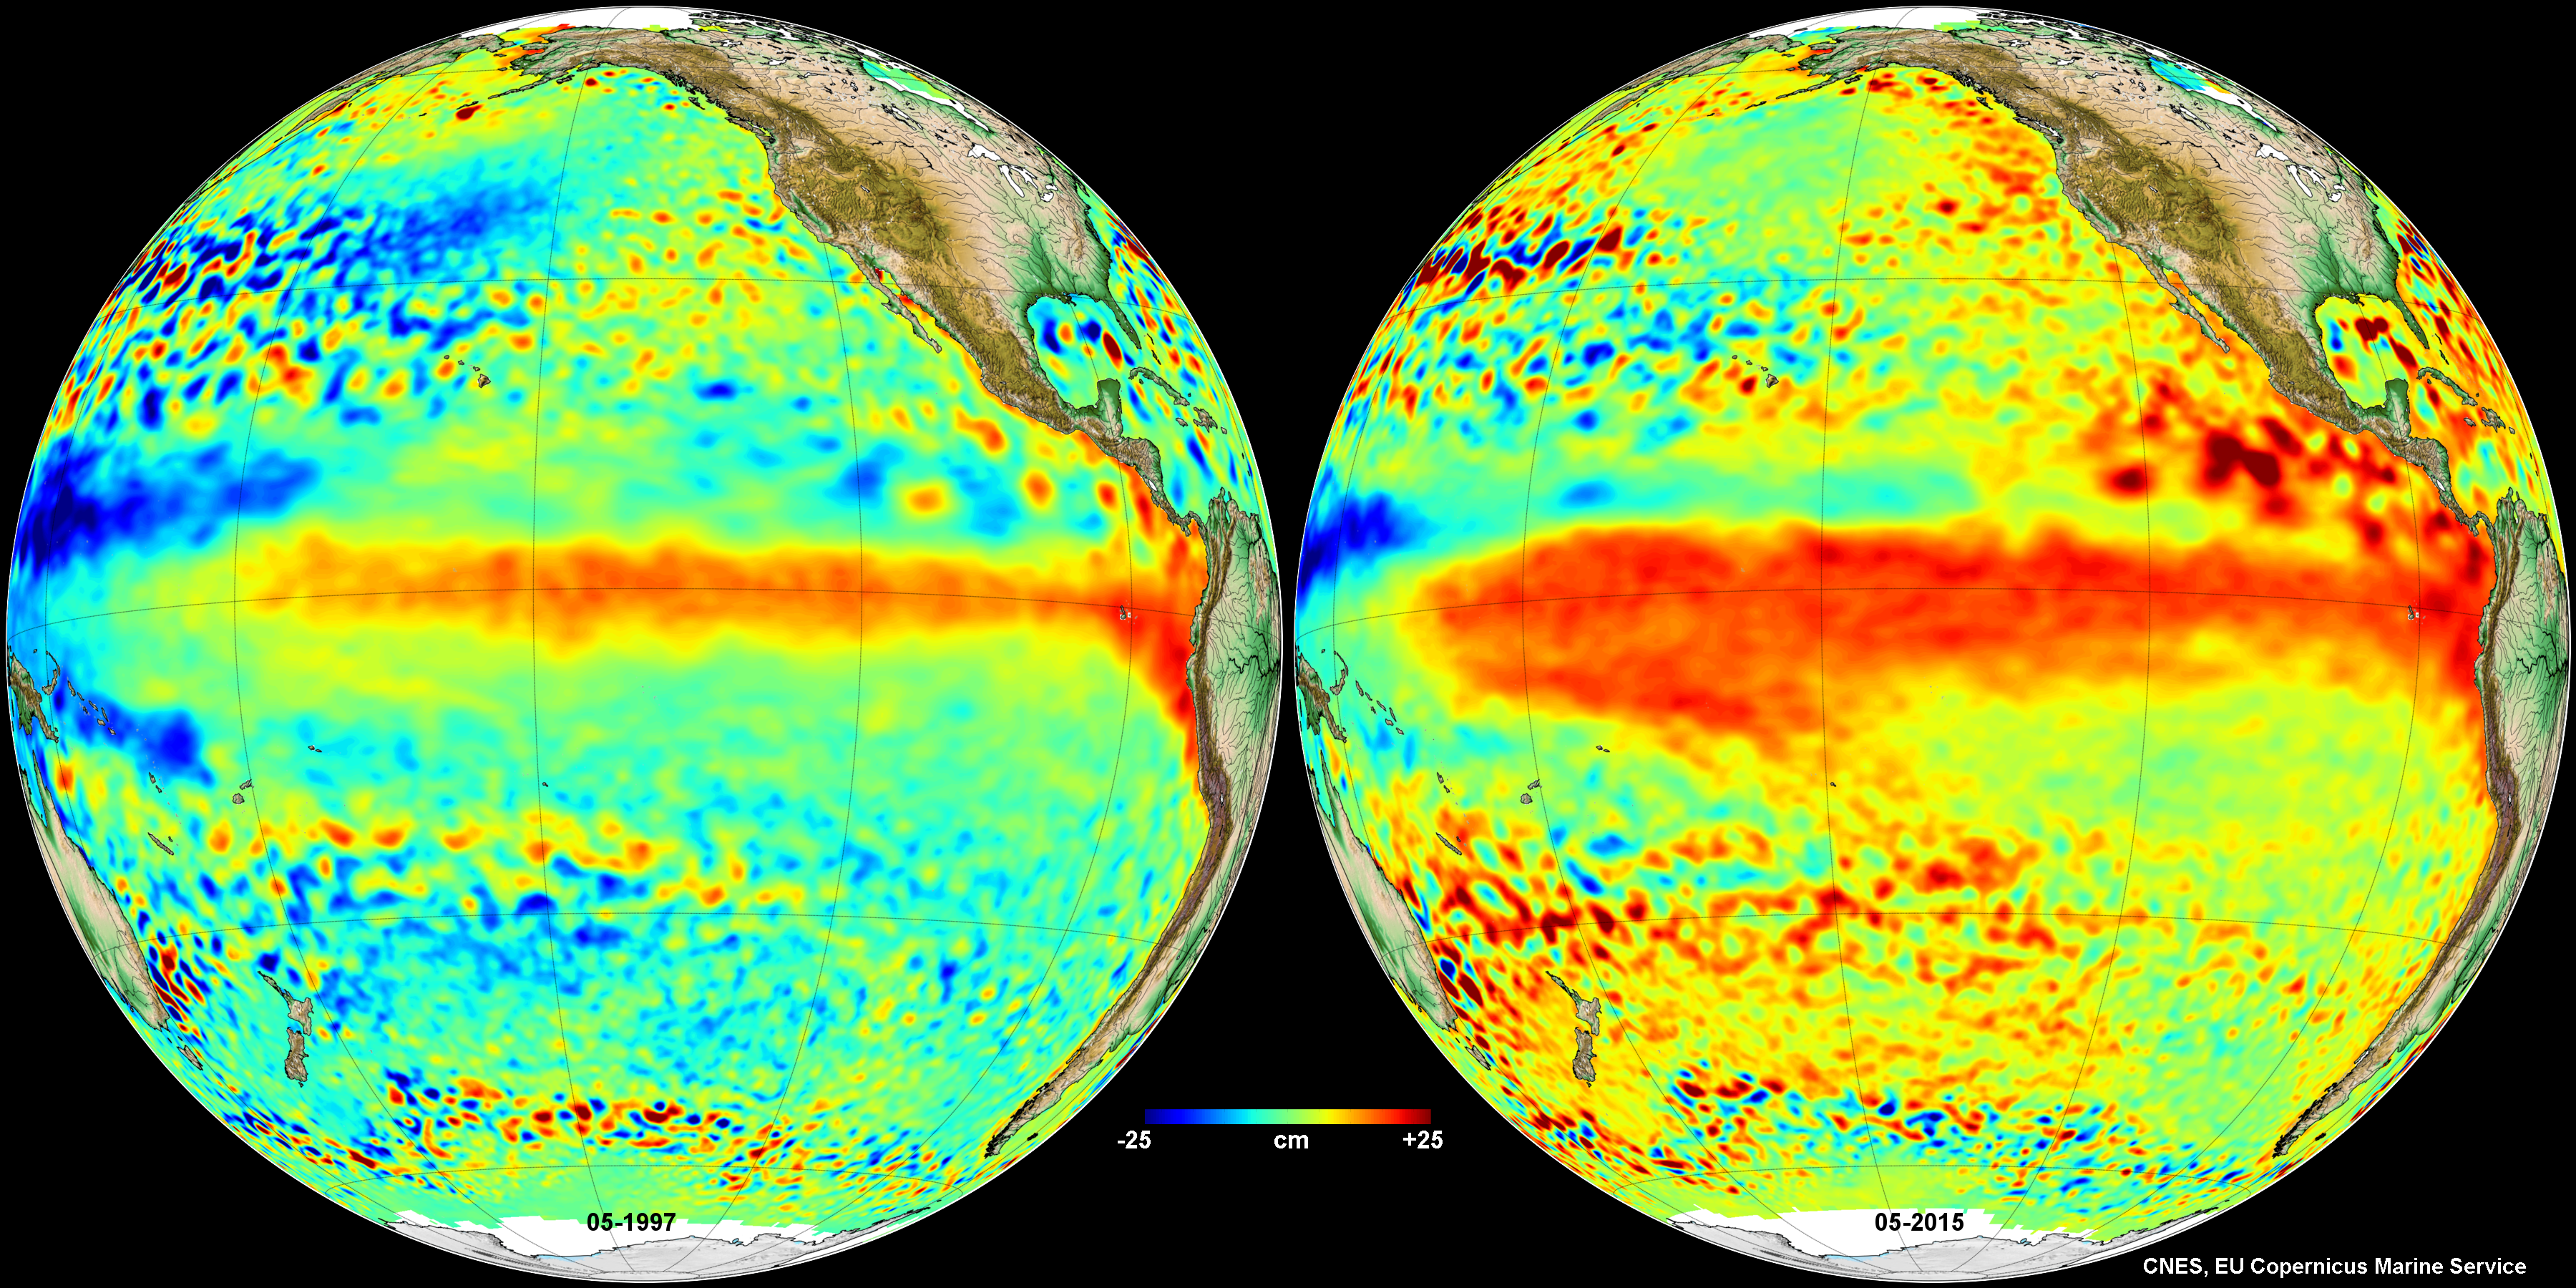
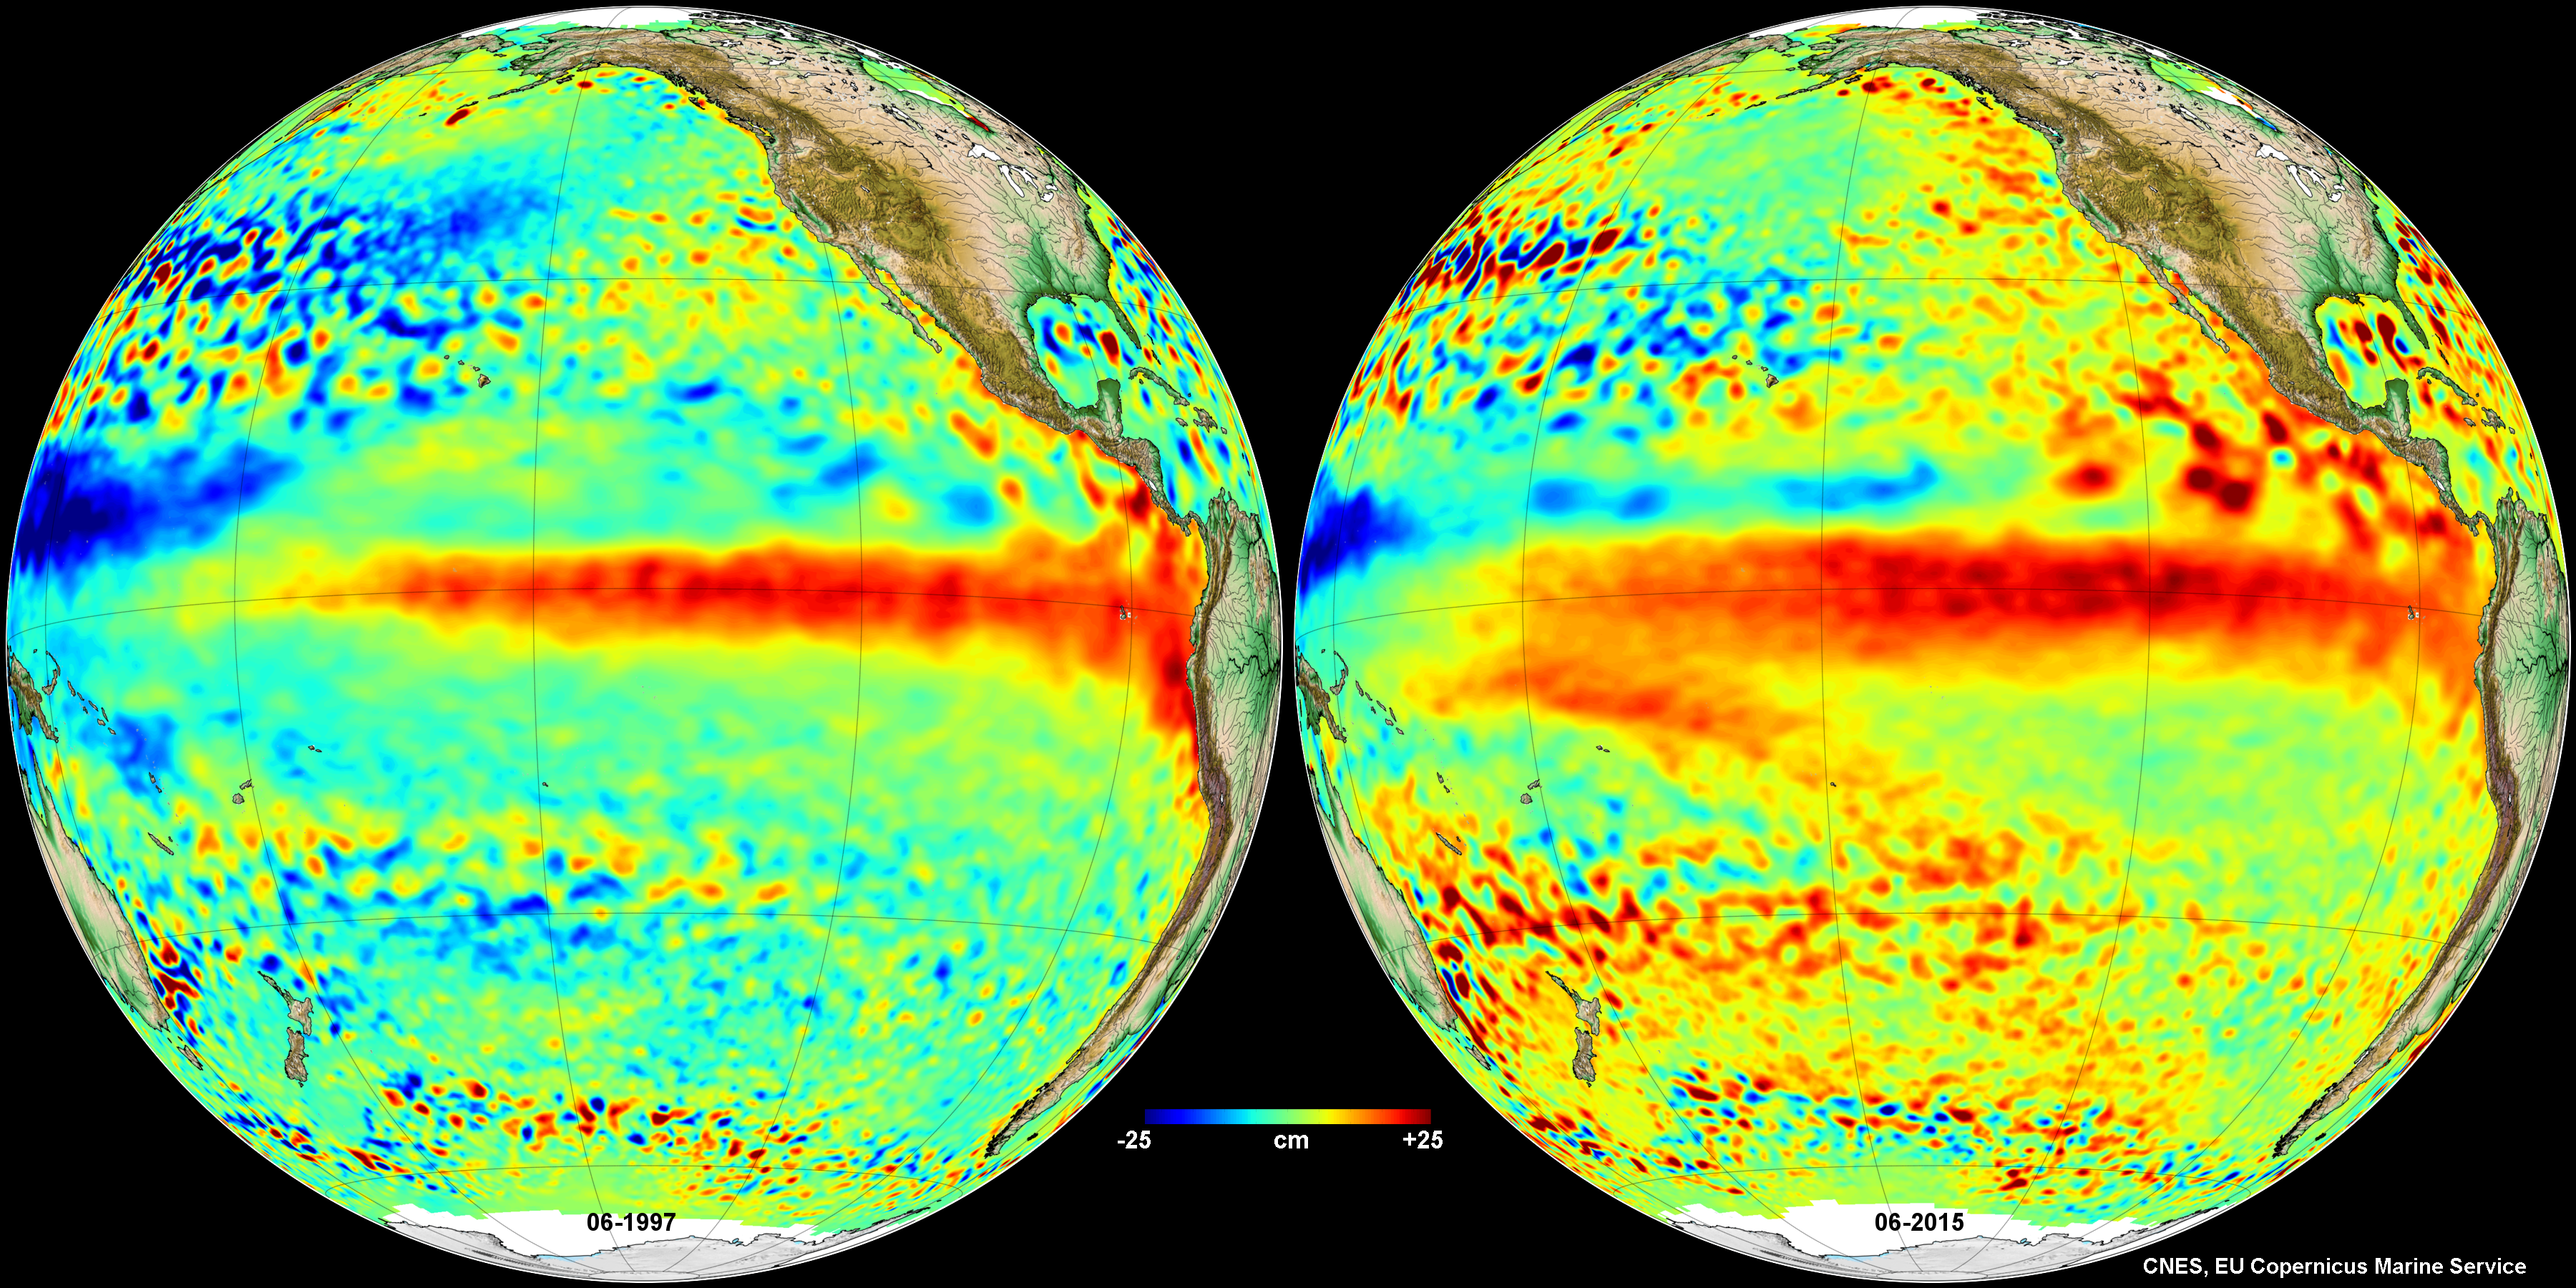
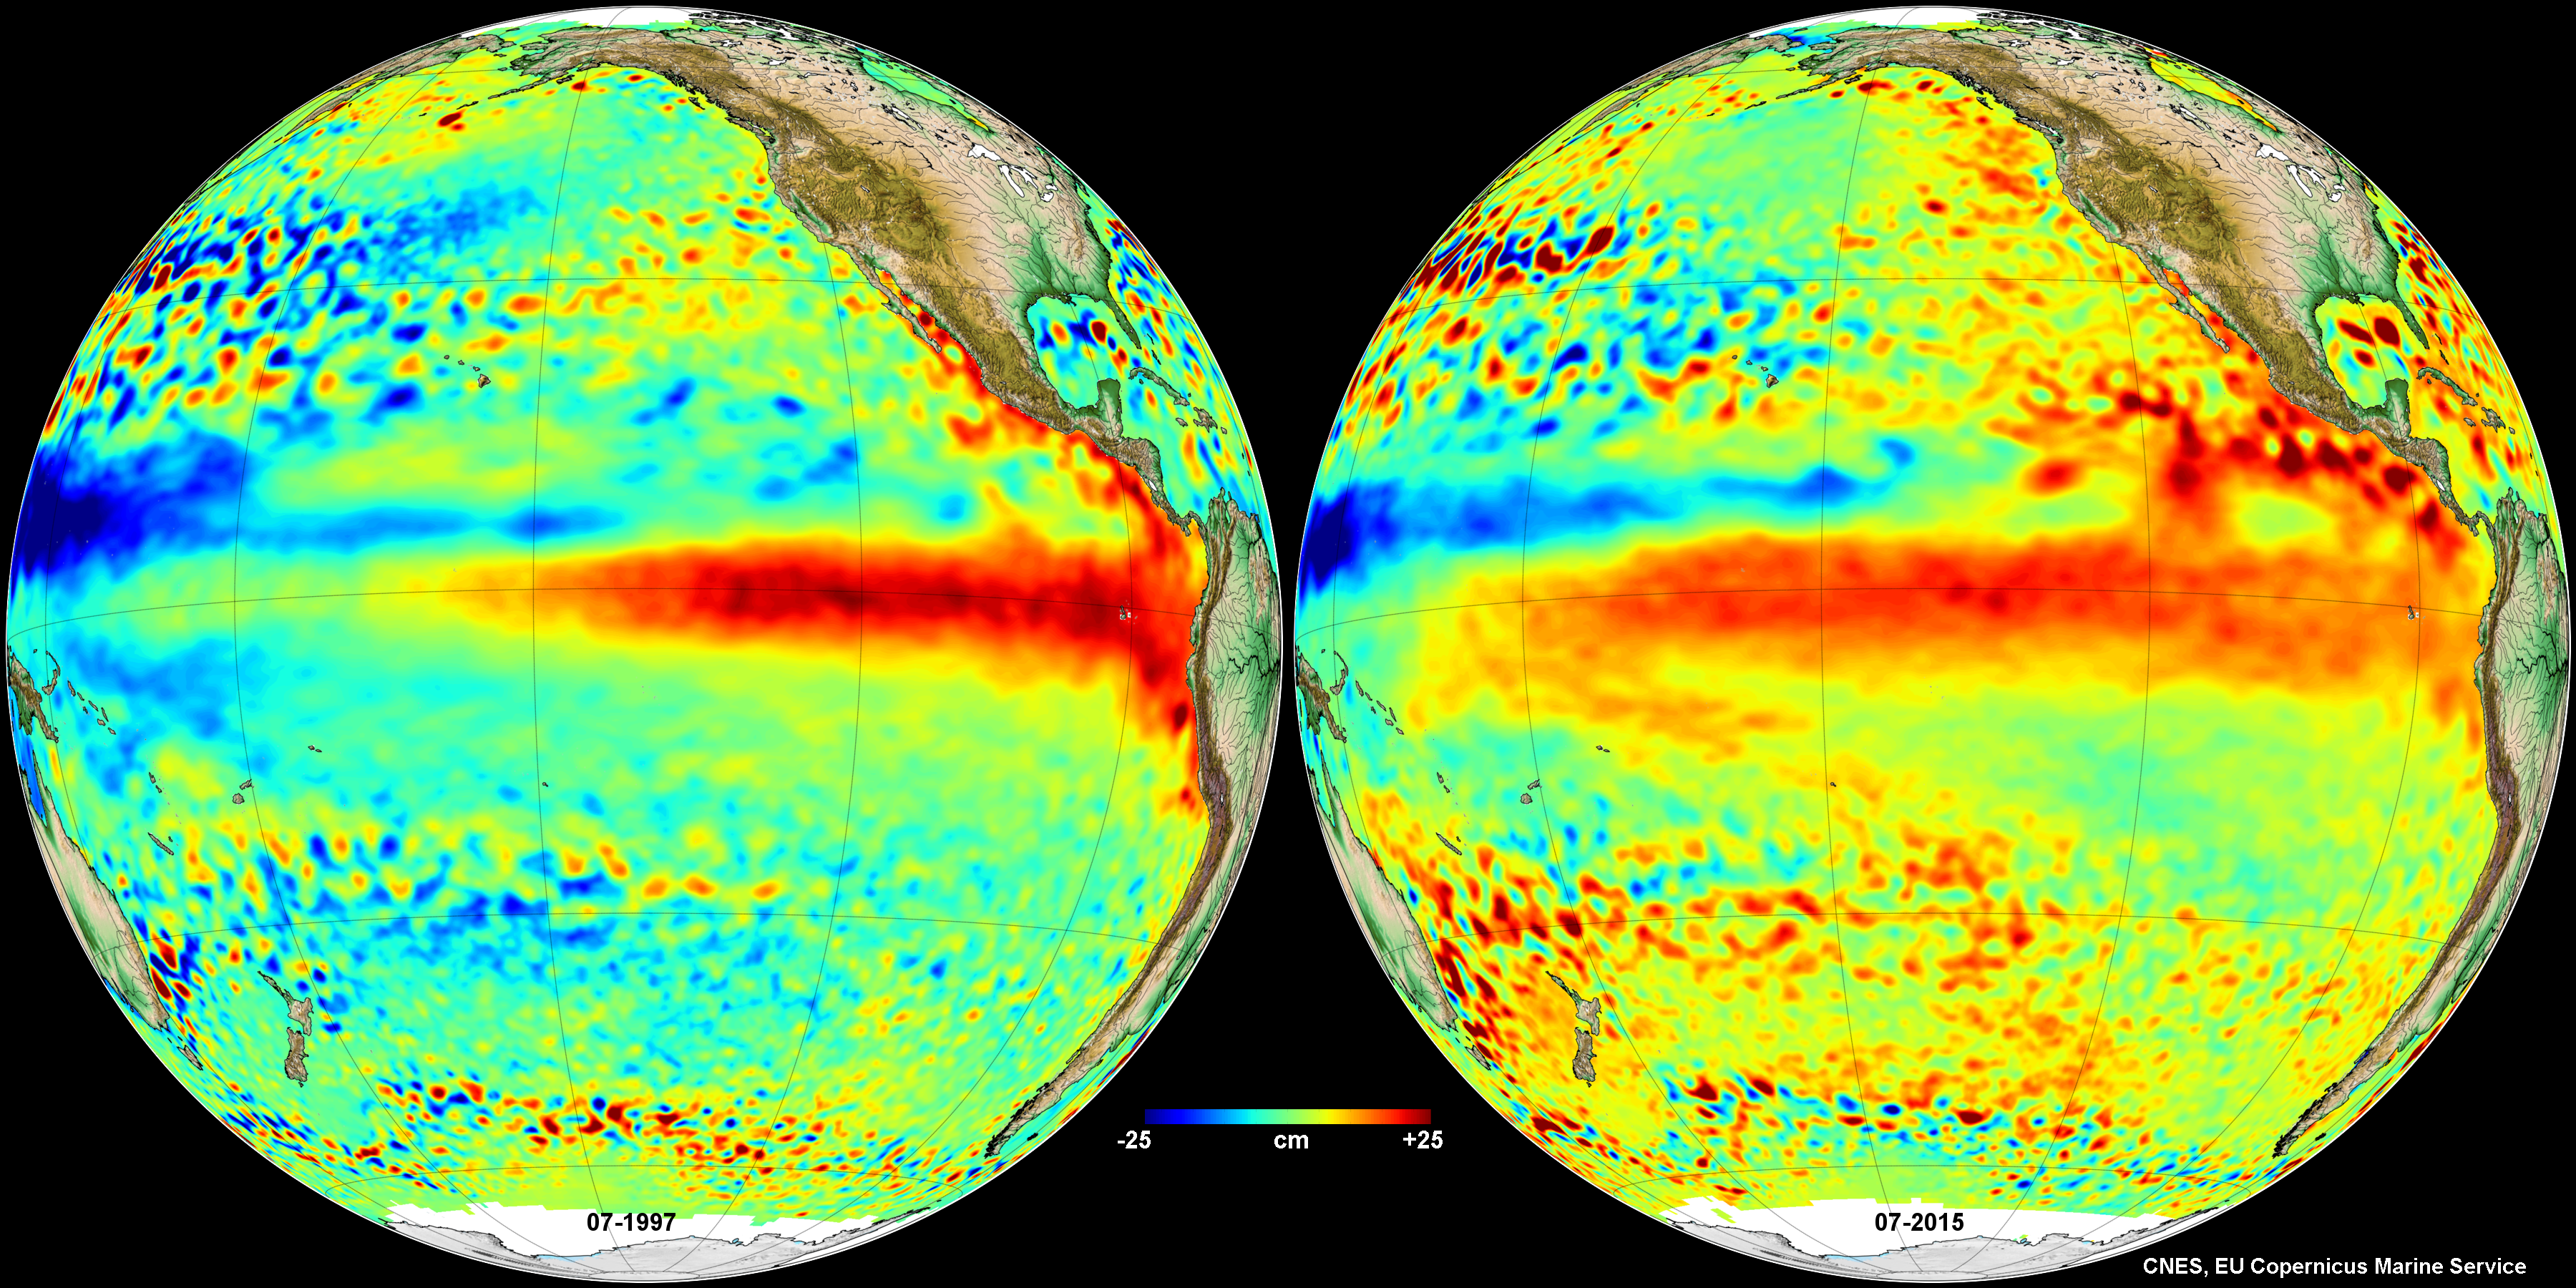
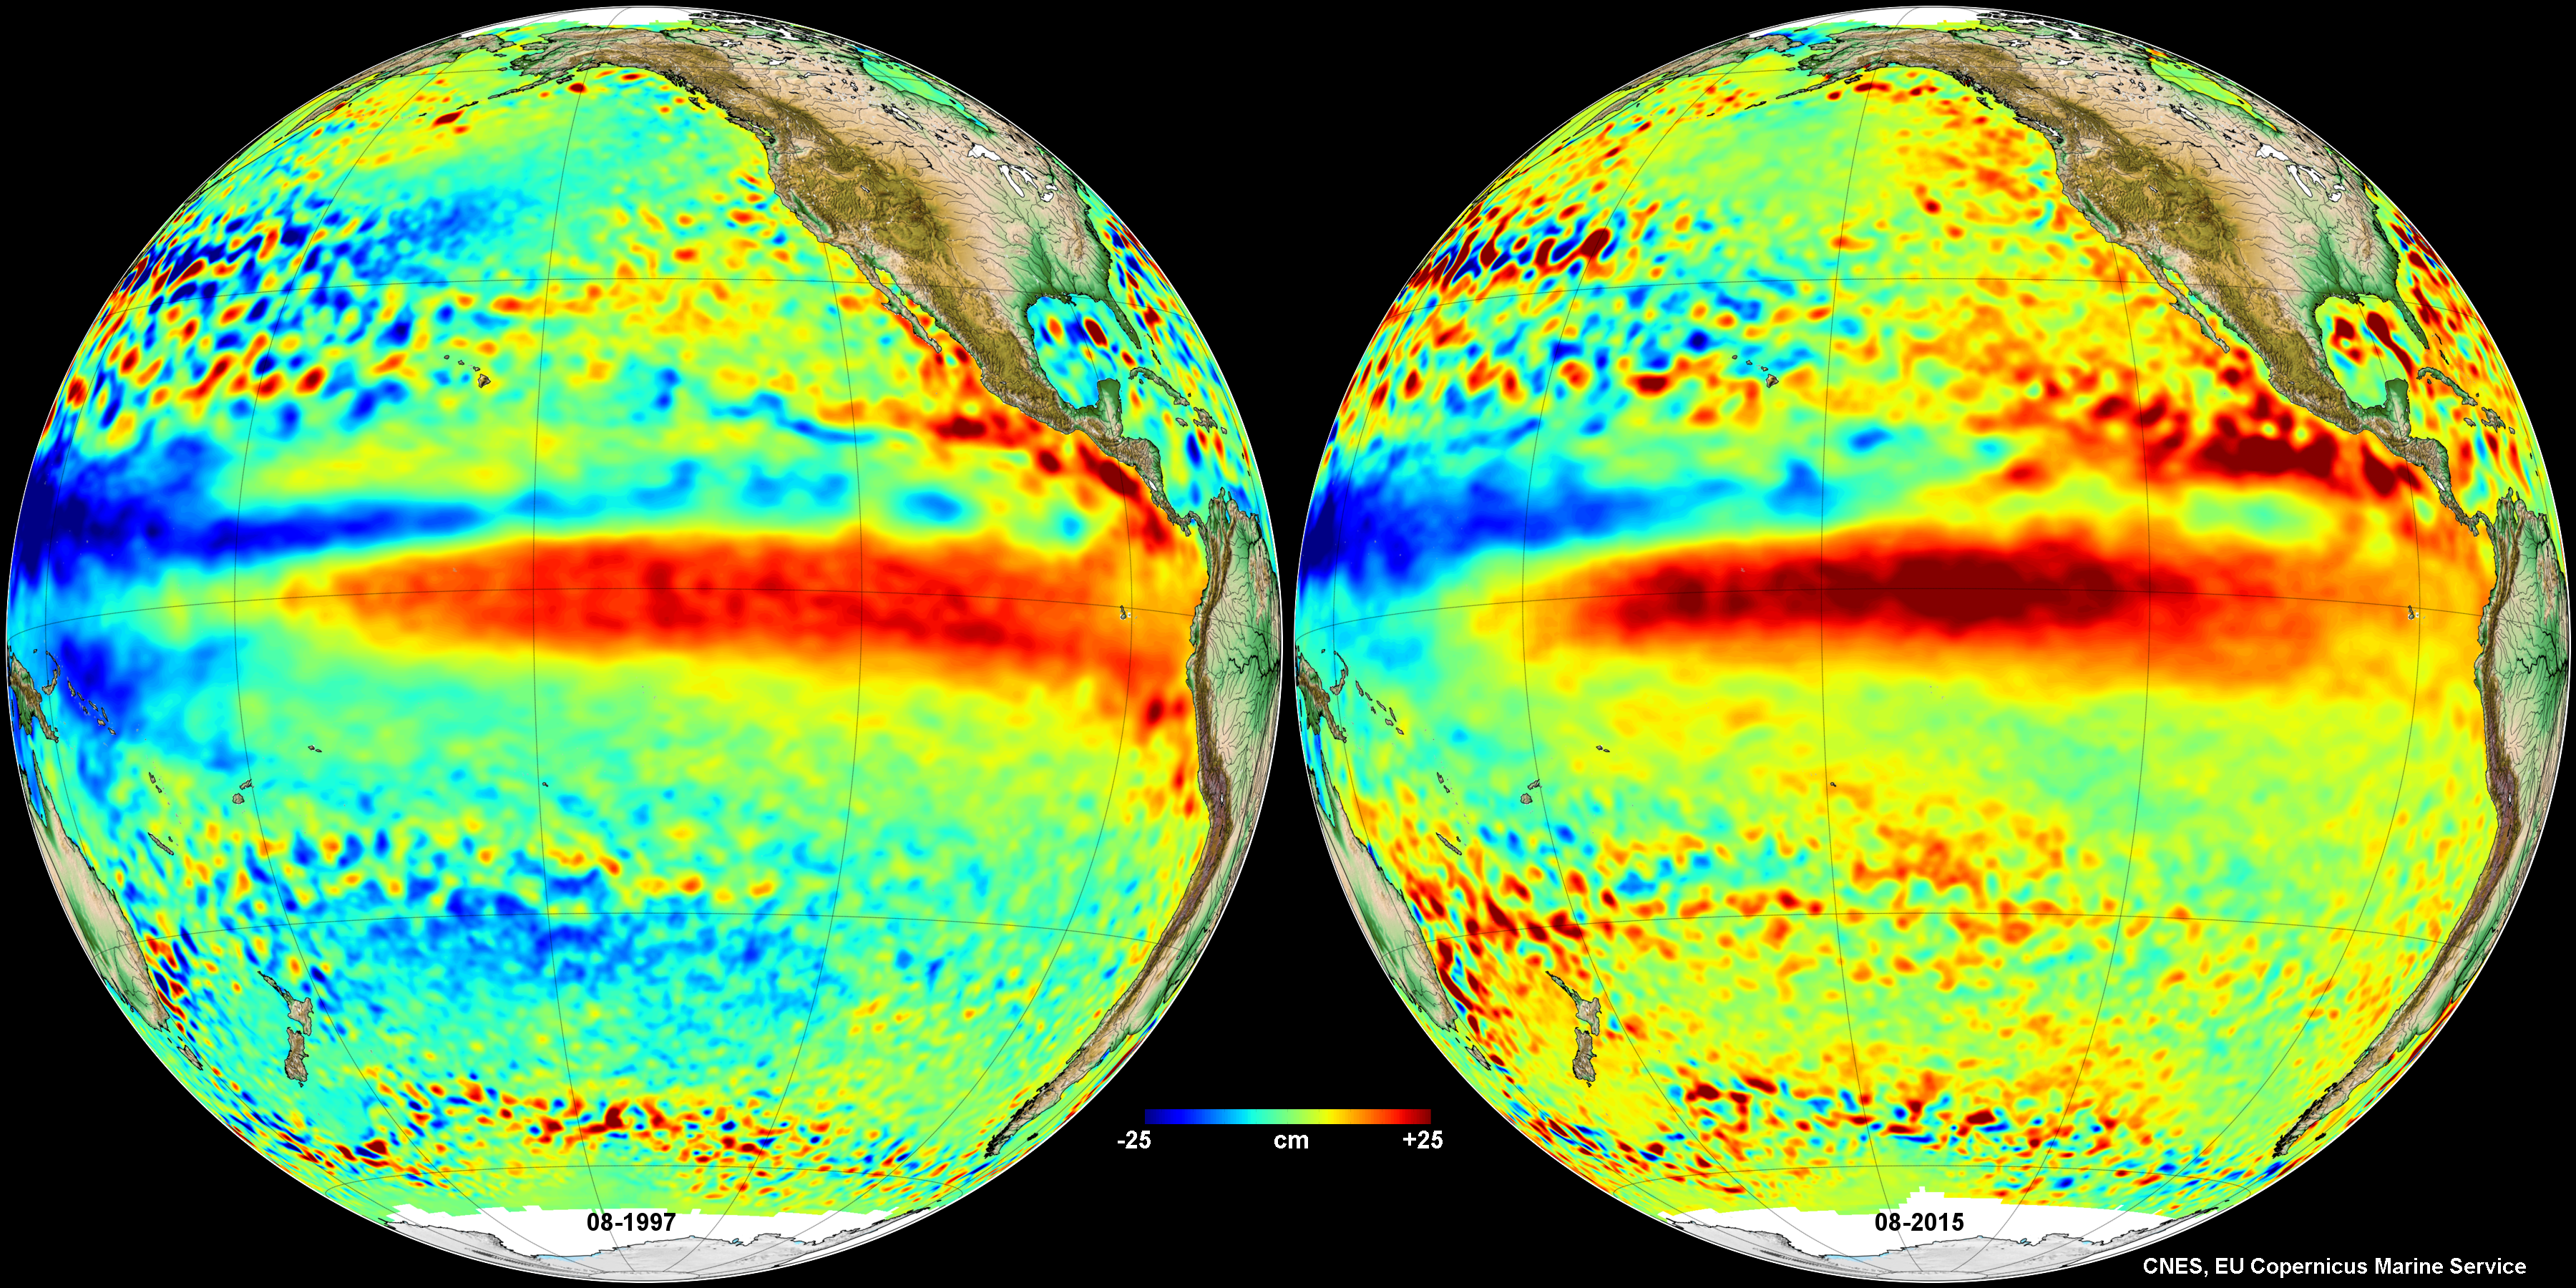
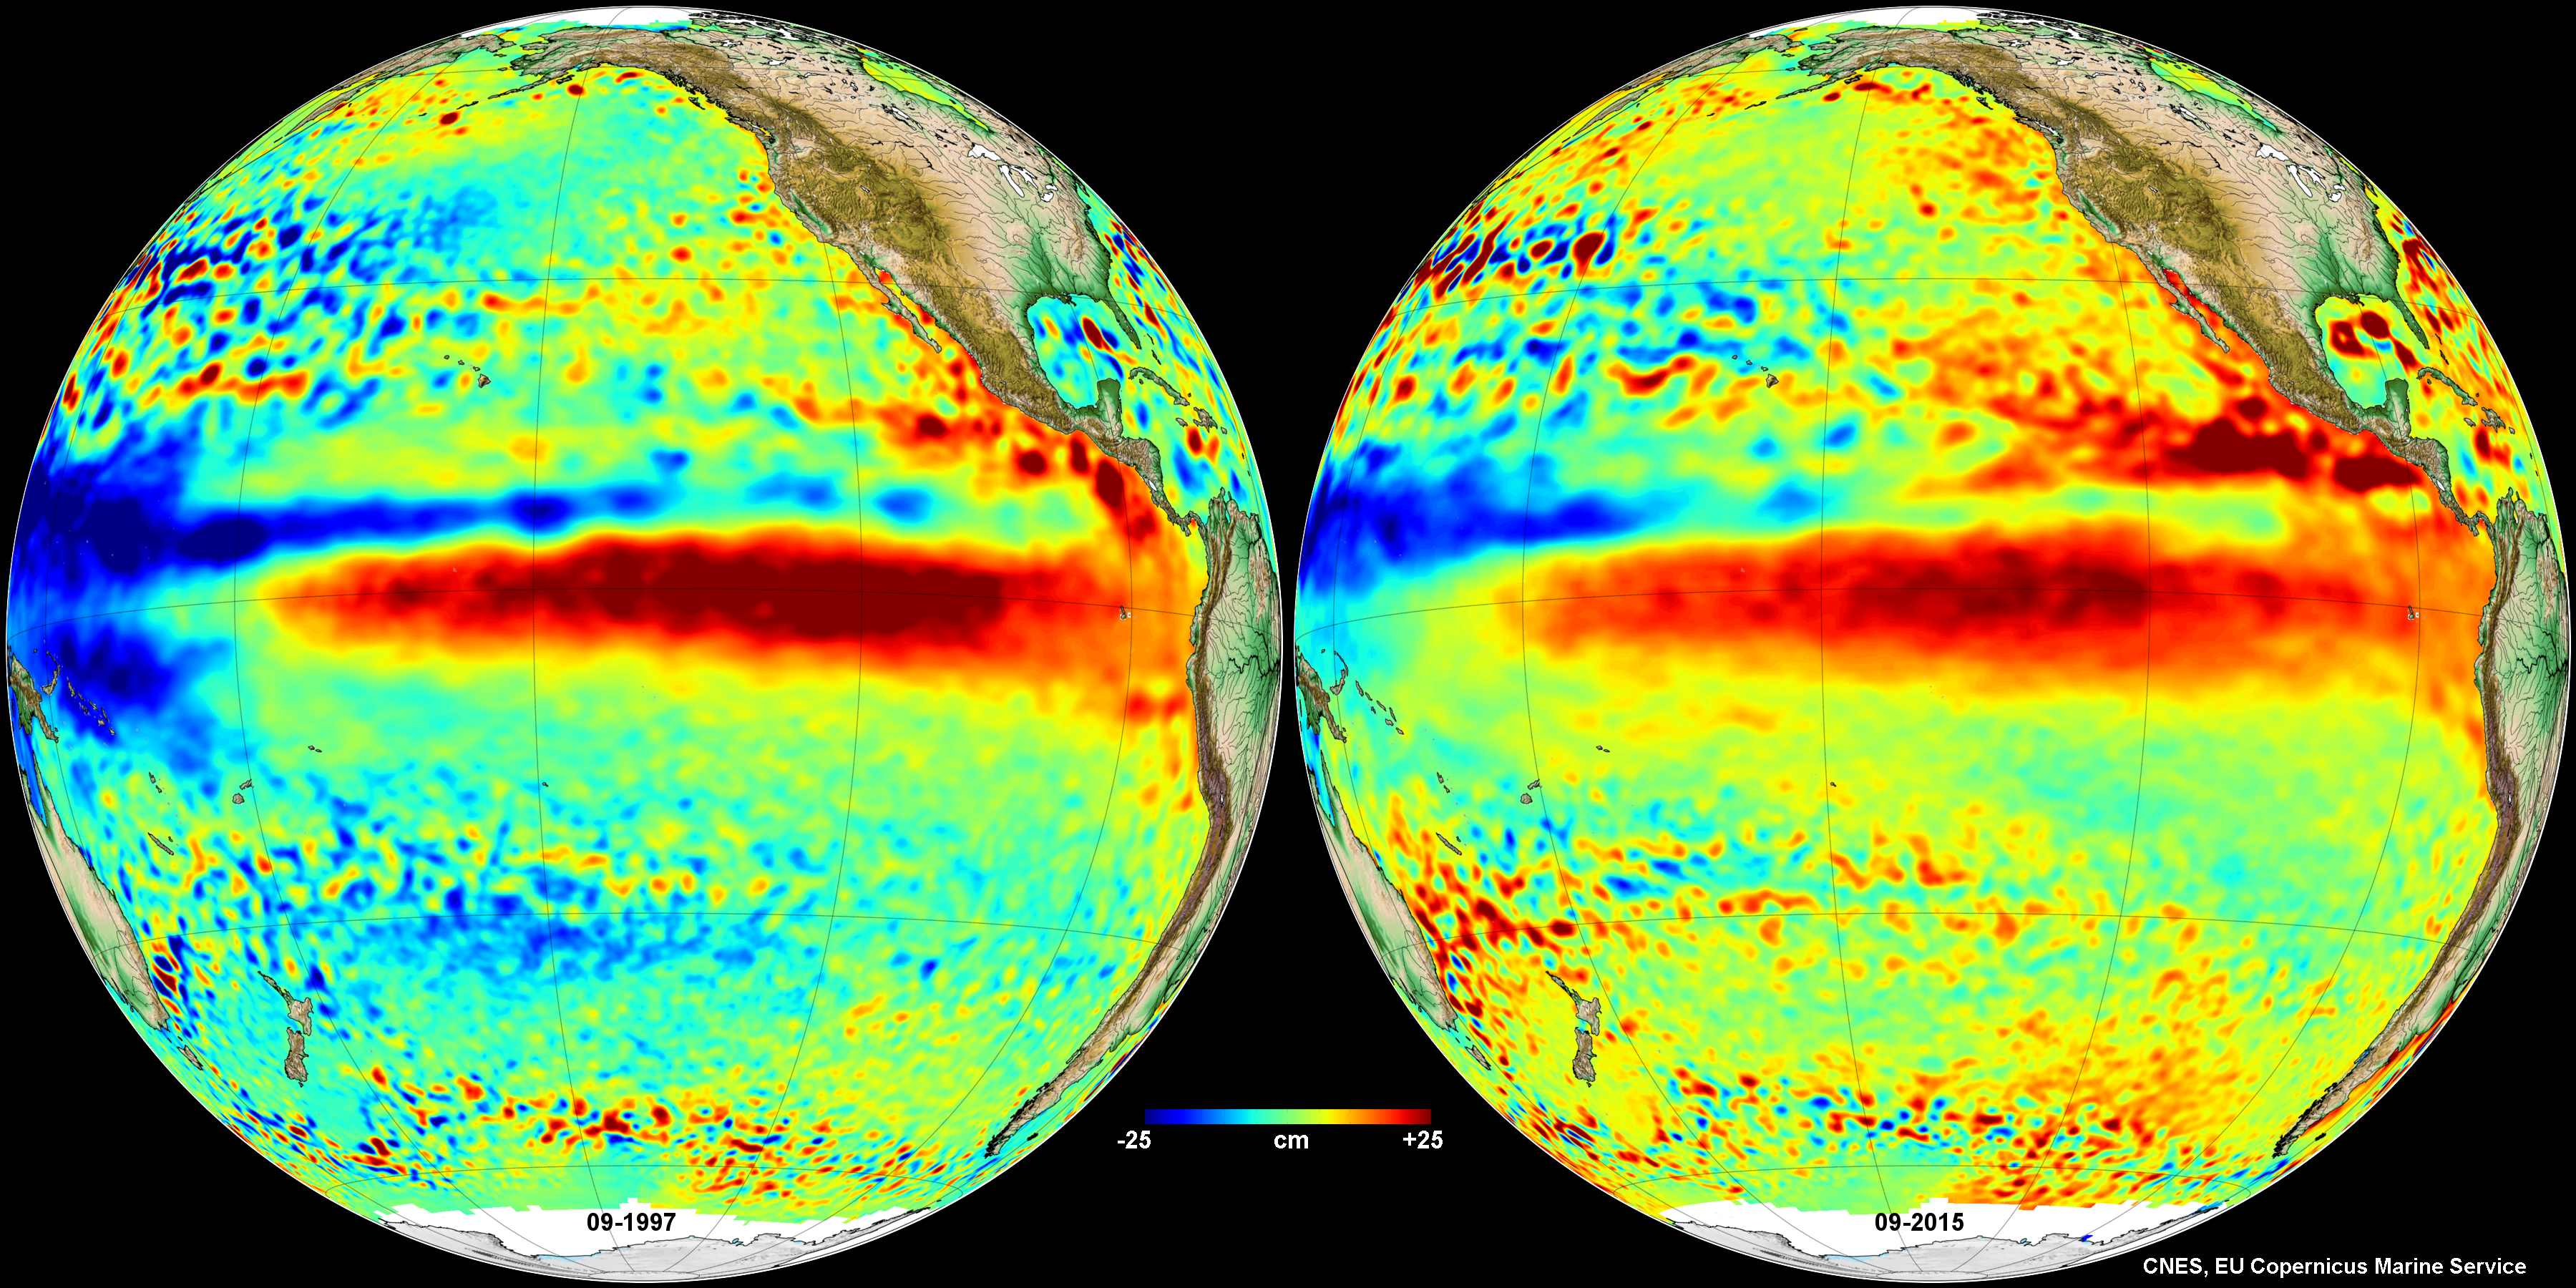
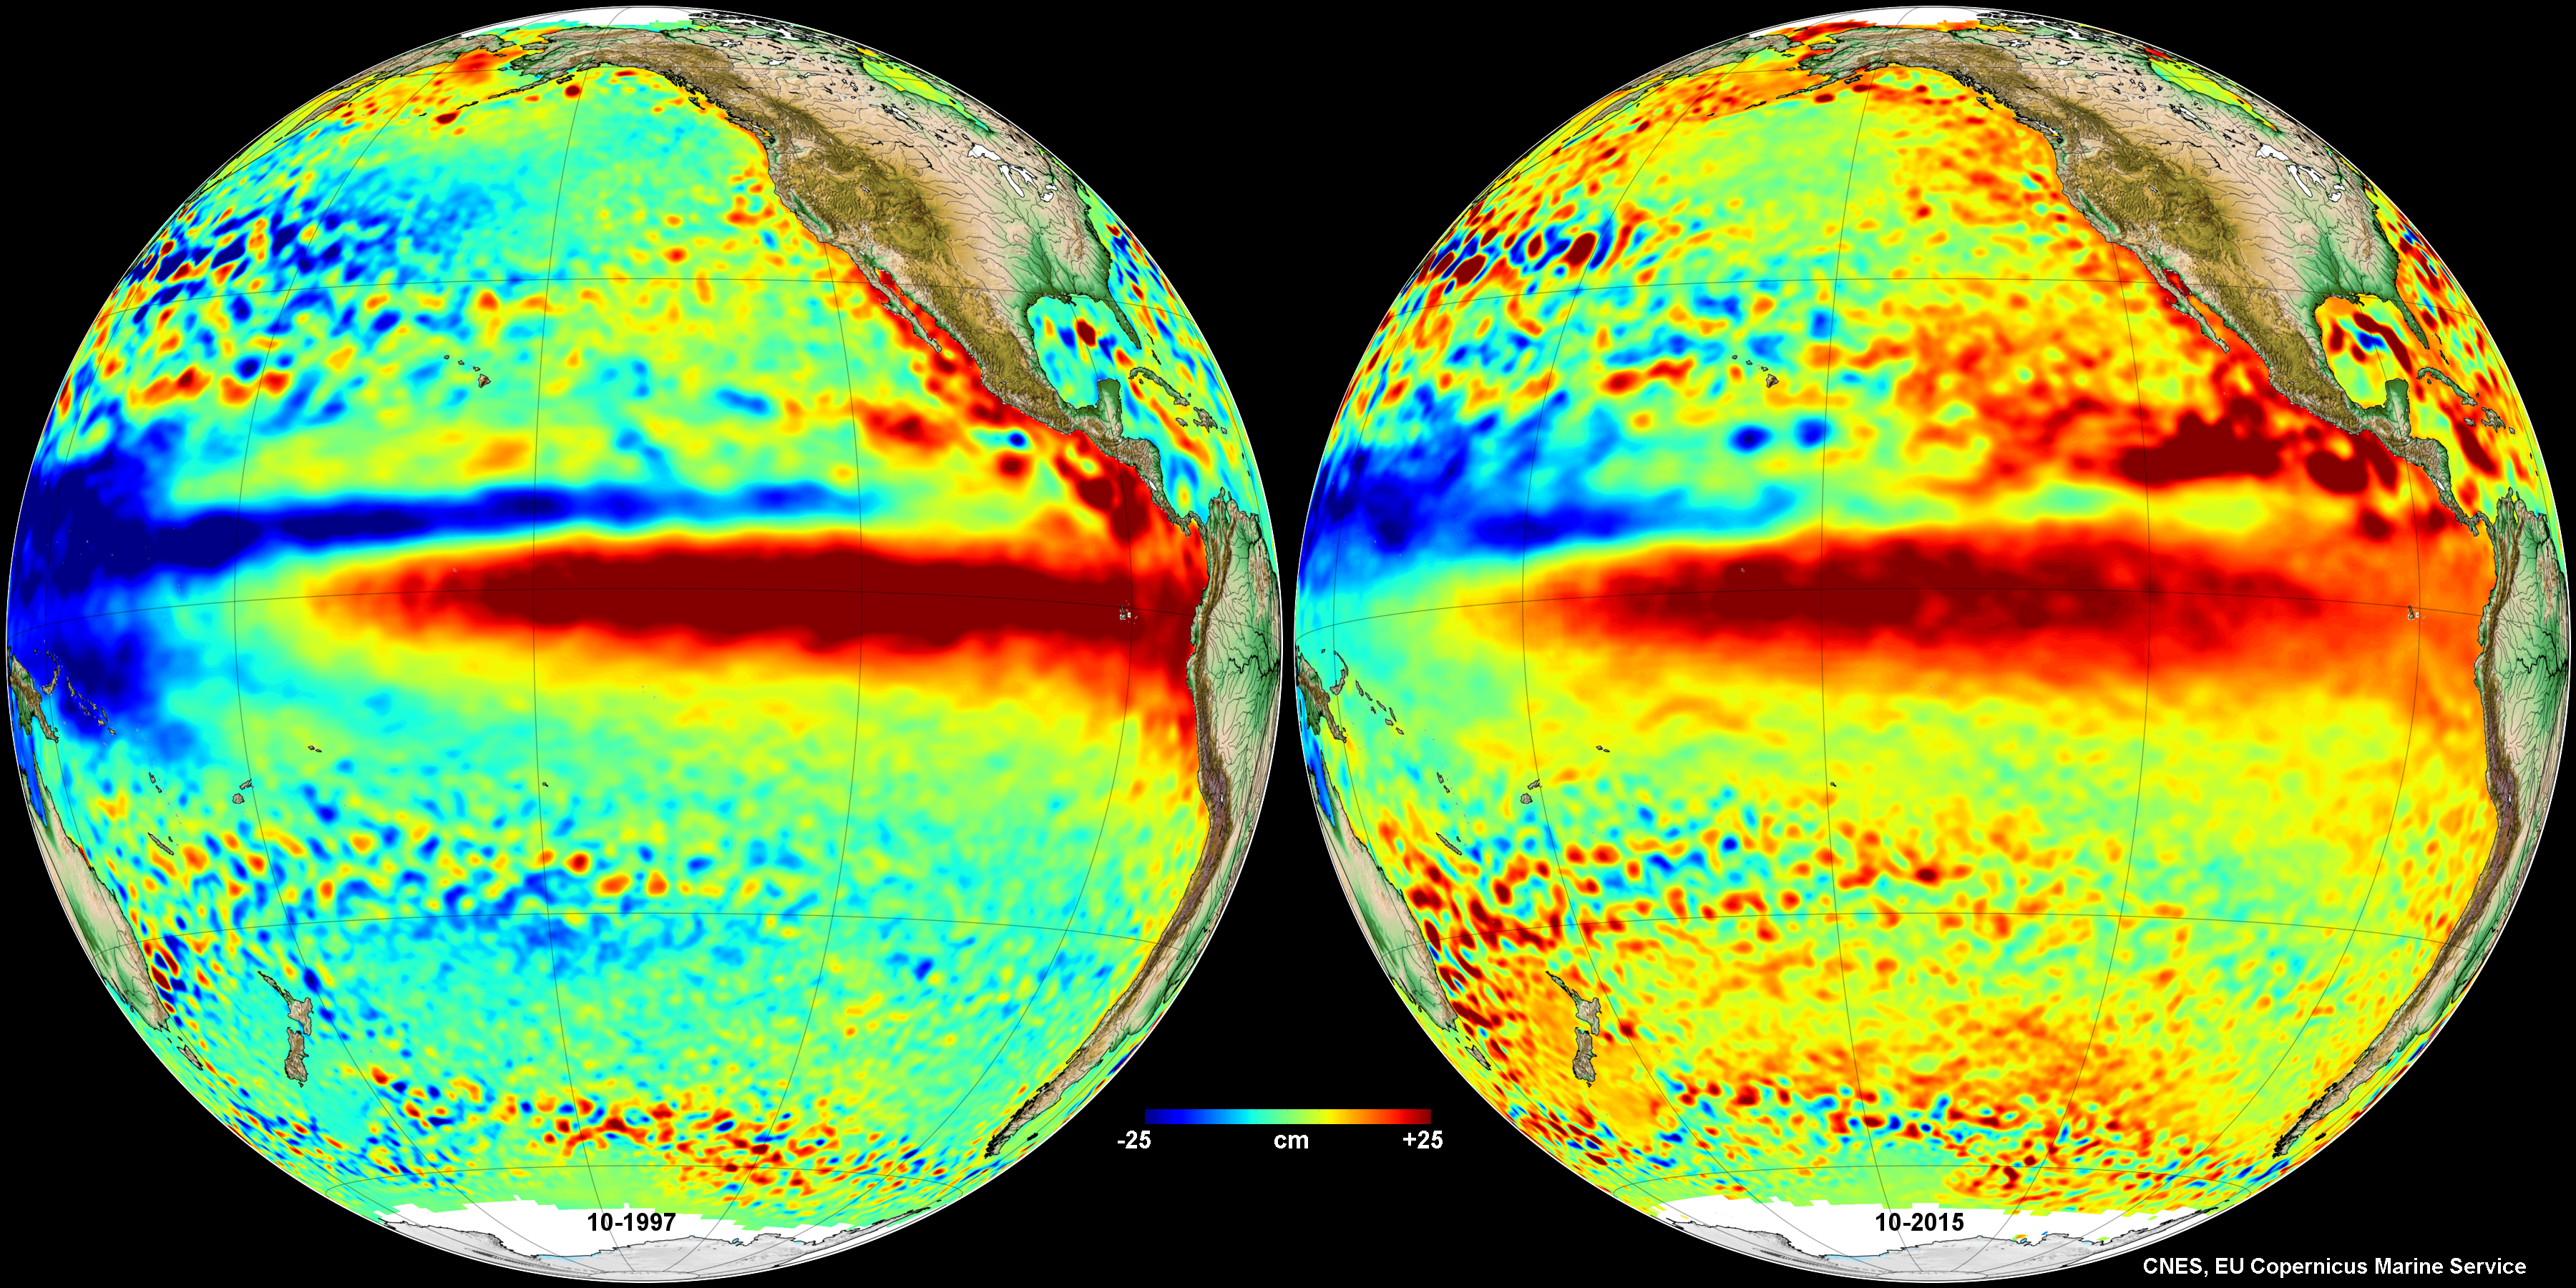
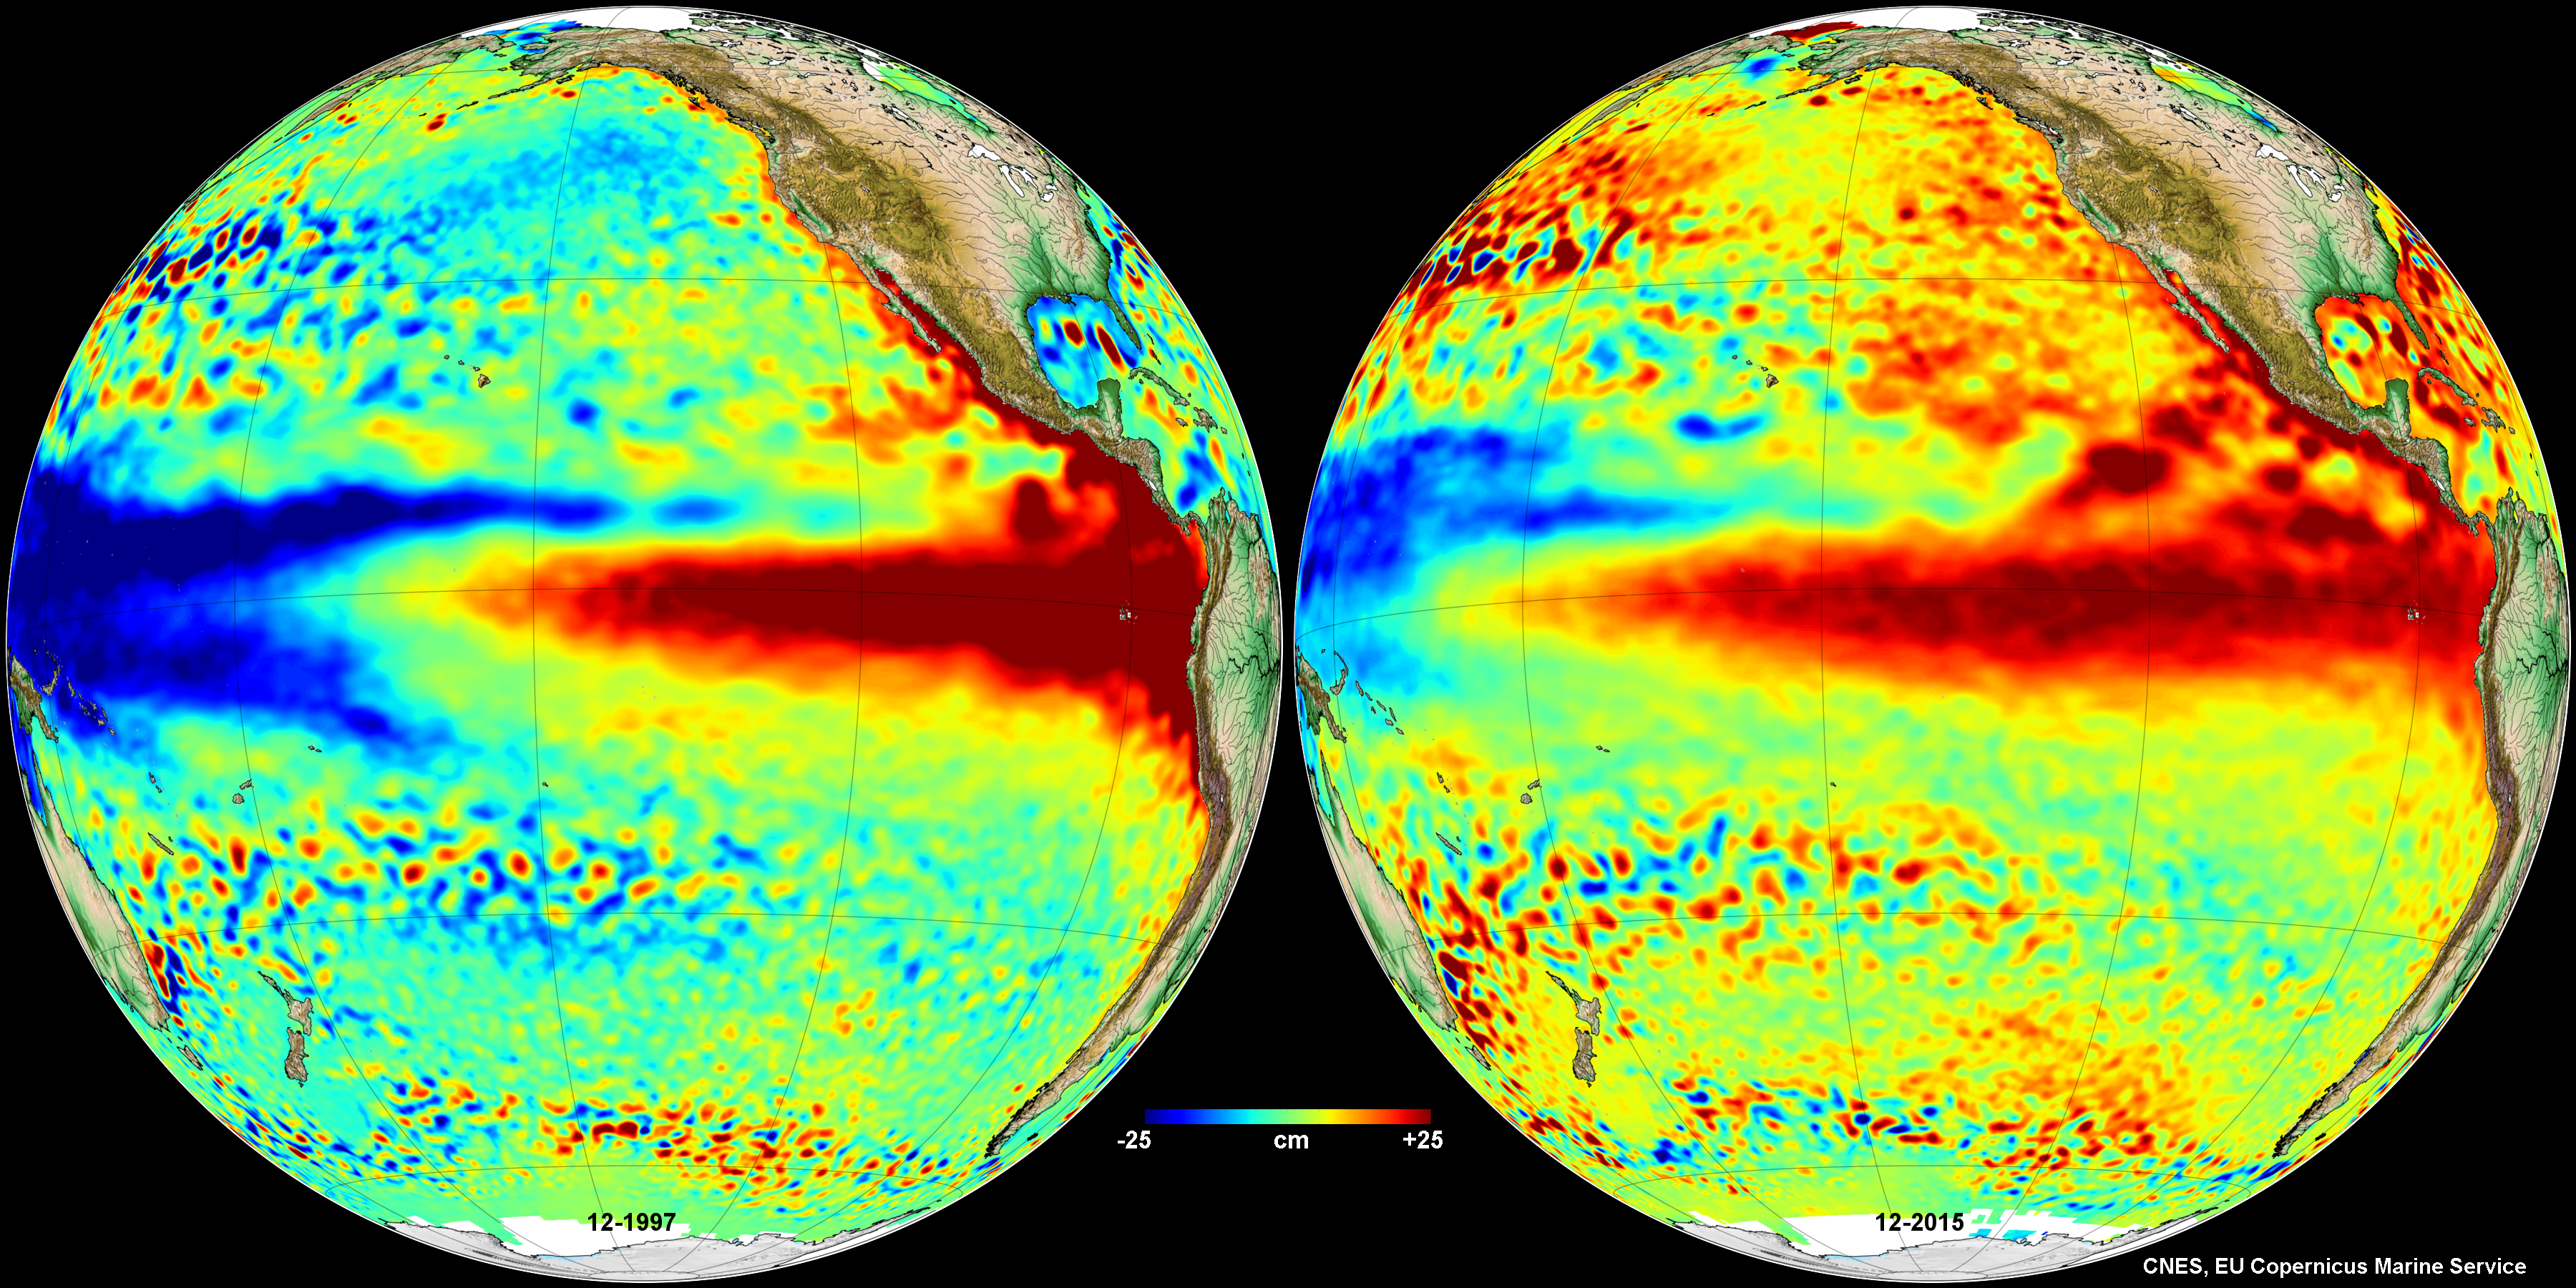
El Niño : comparison 1997 vs 2015
Comparison of montly maps of Sea Level Anomalies (in cm) during El Niño events in 1997 and 2015.
Annual and seasonal cycles are removed from Sea Level Anomalies.
Further information: ENSO
Downloads
| File | Type | Size | Lang | Resolution | Creation date | Represented date |
|---|---|---|---|---|---|---|
| globe2_indic_ENSO_1.png | Image | 5.2Mb | 3600x1800 | 2015-12-15 | ||
| globe2_indic_ENSO_2.png | Image | 5.26Mb | 3600x1800 | 2015-12-15 | ||
| globe2_indic_ENSO_3.png | Image | 5.26Mb | 3600x1800 | 2015-12-15 | ||
| globe2_indic_ENSO_4.png | Image | 5.2Mb | 3600x1800 | 2015-12-15 | ||
| globe2_indic_ENSO_5.png | Image | 5.23Mb | 3600x1800 | 2015-12-15 | ||
| globe2_indic_ENSO_6.png | Image | 5.24Mb | 3600x1800 | 2015-12-15 | ||
| globe2_indic_ENSO_7.png | Image | 5.1Mb | 3600x1800 | 2015-12-15 | ||
| globe2_indic_ENSO_8.png | Image | 5.22Mb | 3600x1800 | 2015-12-15 | ||
| globe2_indic_ENSO_9.png | Image | 5.16Mb | 3600x1800 | 2015-12-15 | ||
| globe2_indic_ENSO_10.png | Image | 5.15Mb | 3600x1800 | 2015-12-15 | ||
| globe2_indic_ENSO_11.png | Image | 5.18Mb | 3600x1800 | 2015-12-15 | ||
| globe2_indic_ENSO_12.png | Image | 5.09Mb | 3600x1800 | 2015-12-15 |
- Geographic area : Pacific Ocean
- Instrument : Altimeter
- Parameter : Sea level anomalies
- Topic : El Niño
- Satellite : Multimission