

CNES/CLS - MIT/GCM - JPL
Example of SWOT simulated data over ocean (video)
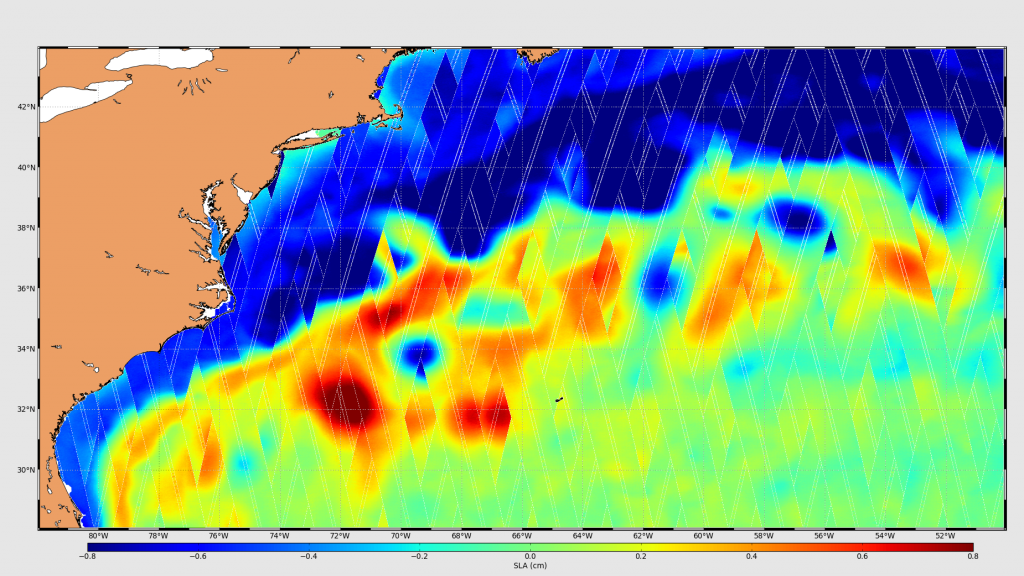
Example of SWOT simulated data from the MIT-Global Circulation Model sampled by the JPL simulator. The data represent the Absolute Sea Surface Height (in cm) over the Gulf Stream area. This animation integrates two cycles of 21 days so a total time lapse of 42 days. The contiguous ground tracks can be separated by several days in time, explaining the topography discontinuities looking like a patchwork. Products to end-users will integrate more processing like dynamic optimal interpolation in order to fill in temporal gaps and to have a continuous reconstruction.
The left/righ swaths (50 km each) from KaRin altimeter and the thin track in the middle from the nadir altimeter is visible on all ground tracks.
Further information : https://doi.org/10.24400/527896/a01-2021.006
Interferometer-altimeter principle
also on https://youtu.be/Br30OmTZEAk
Downloads
| File | Type | Size | Lang | Resolution | Creation date | Represented date |
|---|---|---|---|---|---|---|
| gulfstream_swot292_101.png | Image | 1.83Mb | 1850x1042 | 2016-09-15 | ||
| gulfstream_swot292_cy1.mp4 | Video | 310.63kb | 2016-09-15 |
- Geographic area : Atlantic Ocean
- Instrument : Altimeter
- Parameter : Surface height
- Topic : Mesoscale Ocean circulation (eddies)
- Satellite : Swot