


Cnes/Mira Production, 2021
Sea level video
Updated 2021
For over a century, sea level has been monitored by a network of tide gauges. The mean rise over the 20th century has been estimated at between 1.2 and 1.9 mm a year.
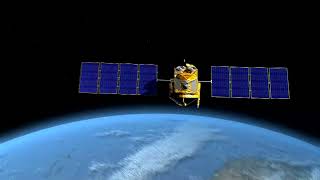
Since 1992, data collected by altimetry satellites have enabled scientists to study sea level variations across the world’s oceans. Sea level rose nearly 10 cm on average around the globe between 1993 and 2020. What’s more, this rise is accelerating as a result of global warming fuelled by greenhouse gas emissions. It’s estimated that expansion of the ocean due to warming accounts for more than 30% of observed sea level rise; the rest is coming mostly from the melting of polar ice caps and continental glaciers. And the rise varies from place to place. In certain regions the mean sea level has risen more than 10 mm a year. Such local disparities are due to the non-uniform expansion of the ocean, which doesn’t store the same amount of heat everywhere.
For the 21st century, predications point to a continuing rise in mean sea level. Current projections are that is will rise 60 to 110 cm by 2100, depending on warming scenarios over the coming decades. Many islands could be submerged. Coastal erosion is likely to intensify and low-lying areas like the Camargue and the Netherlands will also be under threat. Continuous monitoring by satellites over several decades is needed to understand the processes at play, better define which coastal zones are at risk and mitigate the impacts of higher sea levels on coasts.
Downloads
| File | Type | Size | Lang | Resolution | Creation date | Represented date |
|---|---|---|---|---|---|---|
| 01_sea_level.jpg | Image | 4.69kb | 320x180 | 2021-10-01 | ||
| 01_sea_level.mp4 | Video | 22.65Mb | en | 2021-10-01 | ||
| 01_sea_level.pdf | Electronic document | 3.83Mb | en | 2021-10-01 | ||
| 01_niveau_mer.mp4 | Video | 22.64Mb | fr | 2021-10-01 | ||
| 01_niveau_mers.pdf | Electronic document | 3.83Mb | fr | 2021-10-01 |
- Geographic area : All oceans
- Instrument : Altimeter
- Parameter : Sea level anomalies
- Topic : Mean Sea Level
- Satellite : Jason-1, Jason-2, Jason-3, Sentinel-6 (Jason-CS), Topex/Poseidon