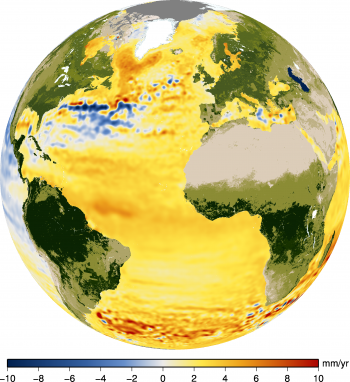
Map of sea level trend over the 1993-2012 period
Map of sea level trend over the 1993-2012 period Map of regional patterns of observed sea level (in mm/year). This map can be obtained using gridded, multi-mission Ssalto/Duacs data since 1993, which enable the local slopes to be estimated with a very high resolution (1/3 of a degree on a Mercator projection). Isolated variations in MSL are thus revealed, mainly in the major ocean currents. see www.aviso.oceanobs.com/msl
Downloads
| File | Type | Size | Lang | Resolution | Creation date | Represented date |
|---|---|---|---|---|---|---|
| msl_map_globe.png | Image | 2.24Mb | en | 2127x2324 |
- Geographic area : All oceans
- Instrument : Altimeter
- Parameter : Surface height
- Topic : Climate, Mean Sea Level
- Satellite : Multimission


