Templates
CasysPlot.Template containing all plot's elements properties.
Parameters
----------
title
Properties of the title (AxeParams).
legend
Properties of the legend (AxeParams).
x1
Properties of the main x-axis (AxeParams).
x2
Properties of the second x-axis (AxeParams).
y1
Properties of the main y-axis (AxeParams).
y2
Properties of the second y-axis (AxeParams).
stat_bar
Properties of the statistics bar (AxeParams).
color_bar
Properties of the color bar (AxeParams).
hist_bar_x
Properties of the x-axis histogram (AxeParams).
hist_bar_y
Properties of the y-axis histogram (AxeParams).
hist_bar_z
Properties of the z-axis histogram (AxeParams).
stat_graph_x
Properties of the x-axis statistics graphic (AxeParams).
stat_graph_y
Properties of the y-axis statistics graphic (AxeParams).
plot
Properties of the plot (PlotParams).
data
Properties of the data (DataParams).
grid
Properties of the grid (GridParams).
coastlines
Properties of the coastlines (FeatureParams).
ticks_spaces
Ticks spaces to apply to each position.
watermarks
List of watermarks.
description
Description of the template.
text
Textual elements properties to apply to other elements (TextParams).
PlotTemplate can be obtained:
By manually instantiating a
PlotTemplate,From the
templateattribute of an existing plot,Using the
load()method with the name of a stored or registered template,Using the
set_template()method withDataParams,PlotParamsand/orTextParamsUsing the
set_template()method with an existingPlotTemplateupdated withDataParams,PlotParamsand/orTextParams.
PlotTemplate can be used:
When instantiating a
CasysPlot.When instantiating a
CasysPlotusing thefrom_array()method.
template keyword and can be updated by providing
DataParams,
PlotParams and/or
TextParams parameters.Creating templates
From scratch
from casys import CasysPlot, PlotParams, AxeParams, TextParams, PlotTemplate

t = PlotTemplate(
    legend=AxeParams(label={"size": "large"}),
    title=AxeParams(label={"size": "x-large", "weight": "bold"}),
    plot=PlotParams(grid=False),
    stat_bar=AxeParams(
        label={"fontsize": "small", "weight": "light"},
        position="top",
        enabled=True,
    )
)
default values for the
plot’s elements properties. They will overwrite the auto properties automatically
defined for this kind of plot.from casys import CasysPlot
plot = CasysPlot(
data=ad,
data_name="Sigma 0 by day",
stat="mean",
template=t
)
plot.show()

DataParams,
PlotParams and/or
TextParams) at plot instantiation will update
the provided template.from casys import AxeParams, CasysPlot, PlotParams, TextParams, PlotTemplate
t = PlotTemplate(
title=AxeParams(label={"size": "xx-large", "weight": "bold"}),
stat_bar=AxeParams(
label={"fontsize": "large"},
position="top",
enabled=True,
)
)
plot_par = PlotParams(grid=False)
text_par = TextParams(title={"weight": "light", "color": "red"})
plot = CasysPlot(
data=ad,
data_name="Sigma 0 by day",
stat="mean",
template=t,
plot_params=plot_par,
text_params=text_par
)
plot.show()

From existing plots
template attribute.set_ticks(),
set_size(),
add_stat_graph(),
add_hist_bar(), …) and can be used to
instantiate a new plot.Examples
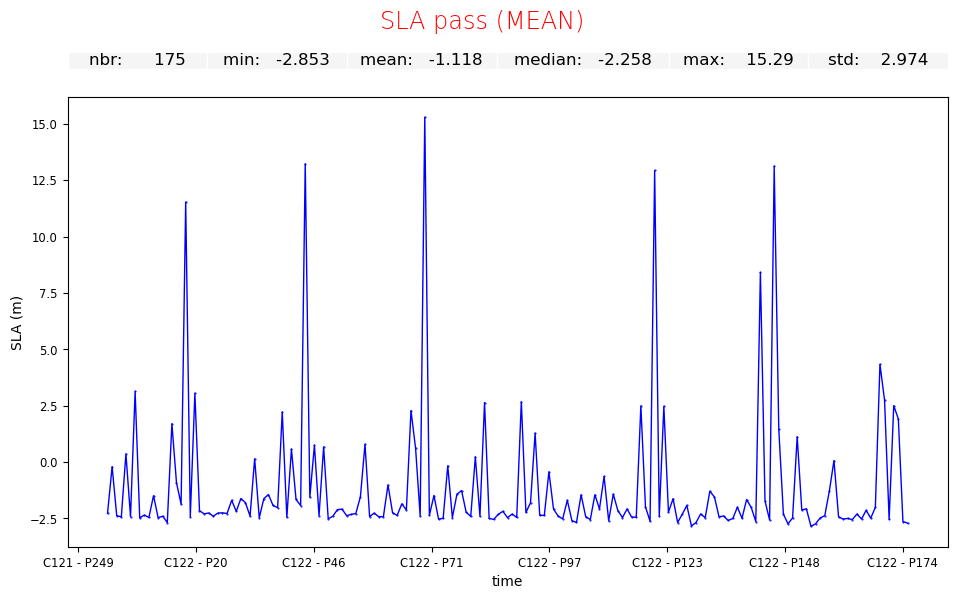
plot.set_ticks(fmt="CP")

# Getting plot's template
t_alti = plot.template

plot_2 = CasysPlot(
    data=ad,
    data_name="SLA pass",
    stat="mean",
    template=t_alti
)
plot_2.show()
import cartopy.crs as ccrs

from casys import (
    AxeParams,
    CasysPlot,
    DataParams,
    PlotParams,
    TextParams,
    PlotTemplate,
)

plot_par = PlotParams(
    fill_ocean=False,
    projection=ccrs.PlateCarree(central_longitude=180.0),
    grid=False,
    color_limits=(10, 17),
    y_limits=(-90, 90),
    fig_height=4.5
)
text_par = TextParams(
    legend={
        "size": "large",
    },
    title={"size": "x-large", "weight": "bold"},
)
data_par = DataParams(points_min_radius=0.2)
color_bar_param = AxeParams(
    label={"label": "m"}, ticks={"labelsize": "medium"}, enabled=True
)

plot = CasysPlot(
    data=ad,
    data_name="Sigma 0",
    plot="map",
    plot_params=plot_par,
    text_params=text_par,
    data_params=data_par,
)

plot.add_color_bar(position="right", params=color_bar_param)
plot.add_hist_bar(position="bottom")

plot.show()
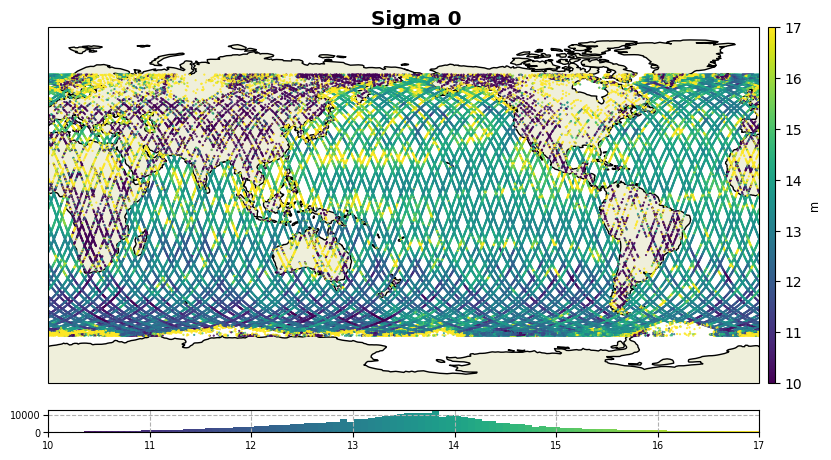
Getting its template for later use.
t_carto = plot.template
From existing templates
set_template() method.Create a new template using provided parameters.
Provided template's ``auto`` level properties are ignored.
Parameters
----------
template
Base template (can be a registered template name).
data_params
Data parameters
plot_params
Plot parameters
text_params
Text parameters
level
Property level to set all properties to.
Returns
-------
:
New updated template.
Note
auto level properties are not included in the newly
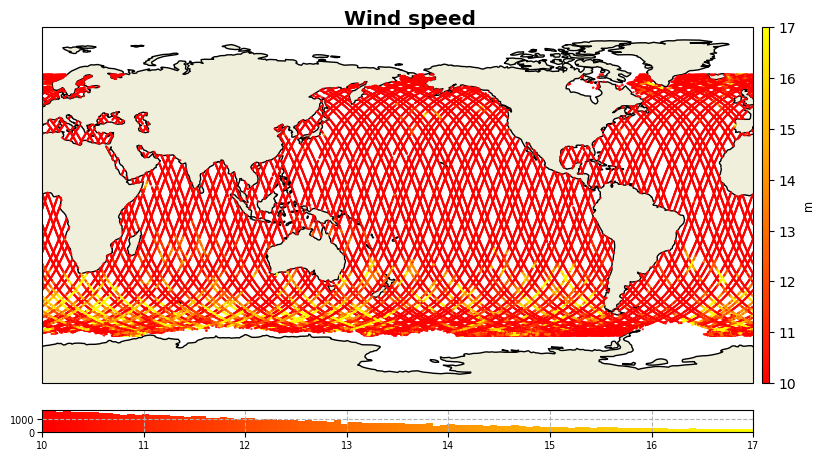
create template.Example
t_autumn = PlotTemplate.set_template(
    template=t_carto,
    plot_params = PlotParams(color_map="autumn")
)

plot = CasysPlot(
    data=ad,
    data_name="Wind speed",
    plot="map",
    template=t_autumn,
)

plot.show()
Storing and loading templates
store() method.YAML file format that might contain many different
templates.Store this template to a file.
Parameters
----------
name
name of the template
path
path of the file
overwrite
Whether to overwrite any existing file or not.
Example
Storing previously used templates into one file.
t.store(name="t", path="generated/templates.yaml", overwrite=True)
t_carto.store(name="t_carto", path="generated/templates.yaml")
t_autumn.store(name="t_autumn", path="generated/templates.yaml")
load() method allows to load a
stored template and use it.Get a registered or stored template.
Templates from the provided path will be added to the template registry.
Parameters
----------
name
Name of the template.
path
Optional custom path to use.
reload
Whether to force the reloading of an already loaded path or not.
Returns
-------
:
Registered template.
Example
from casys import PlotTemplate

t = PlotTemplate.load(name="t_carto", path="generated/templates.yaml")
Template’s registry
PlotTemplate has an internal registry initialized
with a set of predefined templates to which are automatically added user’s stored and
loaded templates.Register a template, so it can be used by its name.
Parameters
----------
name
Name given to the template.
Example
t_carto.register(name="custom_map_template")

plot = CasysPlot(
    data=ad,
    data_name="Wind speed",
    plot="map",
    template="custom_map_template",
)

plot.show()

Advanced usage
Properties priorities
auto: Properties automatically assigned by the plot itself.
defaults: Properties defined at plot’s creation (provided template and additional parameters).
users: Properties added by direct method’s calls.
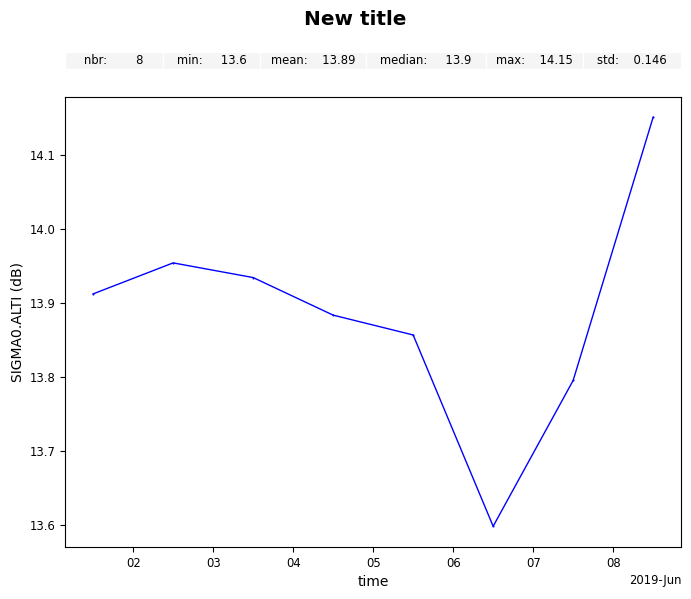
Example
Defining a plot and setting some properties using methods.
template = PlotTemplate(
    title=AxeParams(label={"size": "x-large", "weight": "bold"})
)
plot_par = PlotParams(grid=False)

# default properties
plot = CasysPlot(
    data=ad,
    data_name="Sigma 0 by day",
    stat="mean",
    template=template,
    plot_params=plot_par
)

# user properties
plot.set_title("New title")
plot.set_size(width=7, height=6)
plot.add_stat_bar()

plot.show()
Resetting the plot to its default (initialization) state.
plot.reset()
plot.show()

Note
defaults priority level.Manually editing stored templates
Example
The following YAML content is the result of the 3 previously stored templates.
Note
users, the
users keyword won’t be written.templates:
t:
title:
label:
weight: bold
fontsize: xx-large
stat_bar:
label:
fontsize: large
properties:
enabled: true
position: TOP
t_carto:
title:
label:
defaults:
weight: bold
fontsize: x-large
stat_bar:
label:
defaults:
fontsize: large
color_bar:
label: m
ticks:
labelsize: medium
properties:
position: RIGHT
enabled: true
hist_bar_z:
properties:
defaults:
axis: Z
users:
position: BOTTOM
axis: Z
enabled: true
legend:
label:
defaults:
fontsize: large
plot:
properties:
defaults:
color_limits:
- 10
- 17
fig_height: 4.5
projection:
name: PlateCarree
central_longitude: 180.0
fill_ocean: false
y_limits:
- -90
- 90
grid:
properties:
defaults:
enabled: false
data:
properties:
defaults:
points_min_radius: 0.2
t_autumn:
title:
label:
defaults:
weight: bold
fontsize: x-large
stat_bar:
label:
defaults:
fontsize: large
color_bar:
label: m
ticks:
labelsize: medium
properties:
position: RIGHT
enabled: true
hist_bar_z:
properties:
position: BOTTOM
axis: Z
enabled: true
legend:
label:
defaults:
fontsize: large
plot:
properties:
defaults:
color_limits:
- 10
- 17
fig_height: 4.5
projection:
name: PlateCarree
central_longitude: 180.0
fill_ocean: false
y_limits:
- -90
- 90
users:
color_map: autumn
grid:
properties:
defaults:
enabled: false
data:
properties:
defaults:
points_min_radius: 0.2