GridParams
Warning
This object is not fully working yet and might evolve !
GridParams allows to customize map’s and curve’s
grids.Set of parameters for gridliner in a map.
Parameters
----------
line_properties
A dictionary passed through to collections.LineCollection for styling of the
line of the grid
xlabel_style
A dictionary passed through to ``ax.text`` for styling of the x-axis text labels
ylabel_style
A dictionary passed through to ``ax.text`` for styling of the y-axis text labels
top_labels
Whether to draw labels on the top of the map (default to False)
bottom_labels
Whether to draw labels on the bottom of the map (default to True)
right_labels
Whether to draw labels on the right-hand side of the map (default to False)
left_labels
Whether to draw labels on the left-hand side of the map (default to True)
kwargs
Additional parameters passed to the underlying matplotlib grid or cartopy
gridlines method.
enabled
Whether this GridParams is enabled or not (internally used by schemas).
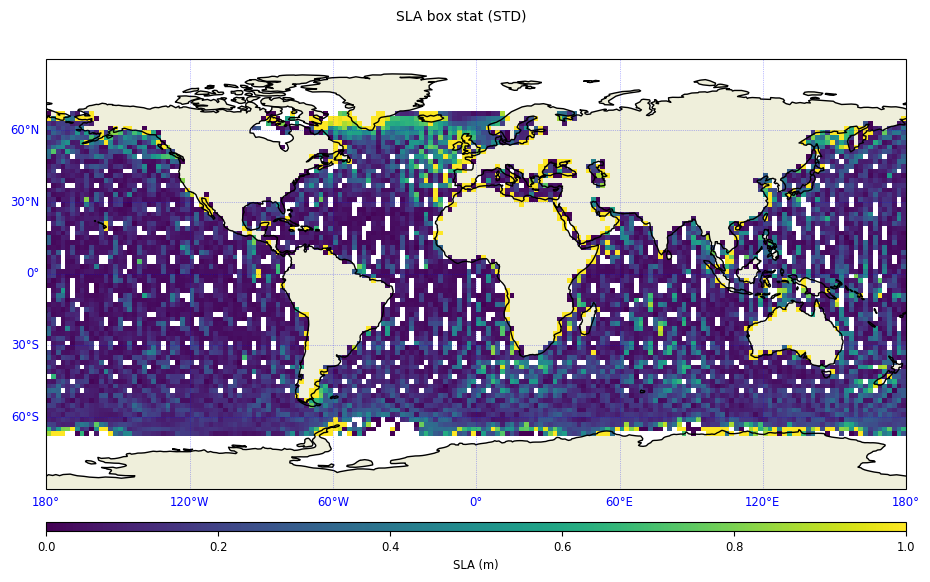
from casys import CasysPlot, GridParams, PlotParams

param = GridParams(
    xlabel_style={"size": "small", "color": "blue"},
    ylabel_style={"size": "small", "color": "blue"},
    line_properties={"linestyle": ":", "linewidth": 0.5, "color": "blue", "alpha": 0.5},
)

plot = CasysPlot(
    data=ad,
    data_name="SLA box stat",
    stat="std",
    plot_params=PlotParams(color_limits=(0, 1), grid=param),
)
plot.show()