TextParams
TextParams allows to customize titles, x and y
labels as well as legends textual elements.Set of text parameters for a plot.
Each parameter can be provided as a string (used as title for the parameter) or a
dictionary passed to the underlying matplotlib function.
Parameters
----------
xlabel
Name and properties of the x-axis label.
Underlying function:
https://matplotlib.org/stable/api/_as_gen/matplotlib.axes.Axes.set_xlabel.html
ylabel
Name and properties of the y-axis label.
Underlying function:
https://matplotlib.org/stable/api/_as_gen/matplotlib.axes.Axes.set_ylabel.html
clabel
Name and properties of the color bar label.
slabel
Name and properties of the stat bar label.
legend
Name and properties of the legend element.
Underlying function:
https://matplotlib.org/stable/api/_as_gen/matplotlib.axes.Axes.legend.html#codecell4
title
Name and properties of the title.
Underlying function:
https://matplotlib.org/stable/api/_as_gen/matplotlib.figure.Figure.html#matplotlib.figure.Figure.suptitle
When using dictionaries, refer to the underlying matplotlib’s function documentation.
Take care, displayed name key is different for each parameter:
title key: t
xlabel key: xlabel
ylabel key: ylabel
legend key: labels
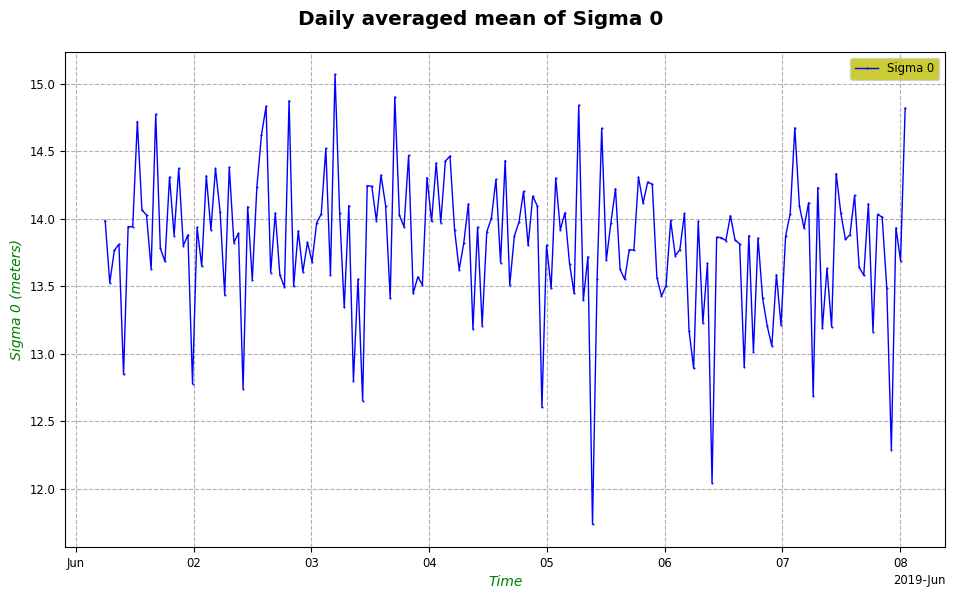
Example: Fully customized textual parameters.
from casys import CasysPlot, PlotParams, TextParams

param = TextParams(
    xlabel={
        "xlabel": "Time",
        "color": "g",
        "style": "italic"
    },
    ylabel={
        "ylabel": "Sigma 0 (meters)",
        "color": "g",
        "style": "italic"
    },
    legend={
        "labels": "Sigma 0",
        "facecolor": "y"
    },
    title={
        "t": "Daily averaged mean of Sigma 0",
        "size": "x-large",
        "weight": "bold"
    }
)

plot = CasysPlot(
        data=ad,
        data_name="SIG0 pass",
        stat="mean",
        plot_params=PlotParams(show_legend=True),
        text_params=param
)

plot.show()
TextParams can be set using the
set_text_params() method on an existing plot.More
TextParams usage examples can be found in this
notebook.