DataParams
DataParams offers a simple way to change the
plot’s data themselves.DataParams without having to recreate the plot.Warning
Using this kind of parameters will affect displayed statistics.
Set of parameters related to plot's data.

Parameters
----------
x_limits
    Crop the plot's data to the provided limits [x_min, x_max]
y_limits
    Crop the plot's data to the provided limits [y_min, y_max]
z_limits
    Crop the plot's data to the provided limits [z_min, z_max]
time_limits
    [Map's raw plots only] Crop the plot's data to the provided
    limits [time_min, time_max]
remove_nan
    Whether NaN values should be removed before plotting or not.
normalize
    Whether histograms should be normalized or not
points_min_radius
    Minimum radius allowed between two points when plotting raw data on maps.
    The radius is expressed in meters.
    Underlying function:
    https://unidata.github.io/MetPy/latest/api/generated/metpy.calc.reduce_point_density.html
center
    Centering options for the data.
    Allowed input values are:

        * numerical values (int/float) -> data_ctr = data - center
        * statistic ("mean", "min", ...) -> data_ctr = data - np.nanmean(data)
transform
    Transformation options for the data.
    Allowed input values (including center parameter ones) are:

        * a function returning an array shaped like data -> data_ctr = f(data)
        * a clip characters string containing the VALUE word (at least once),
          numerical values, arithmetic operations and statistic names:
          "3*VALUE - MEAN/2 + 10" -> data_ctr = 3*data - np.nanmean(data)/2 + 10
DataParams can be set using the
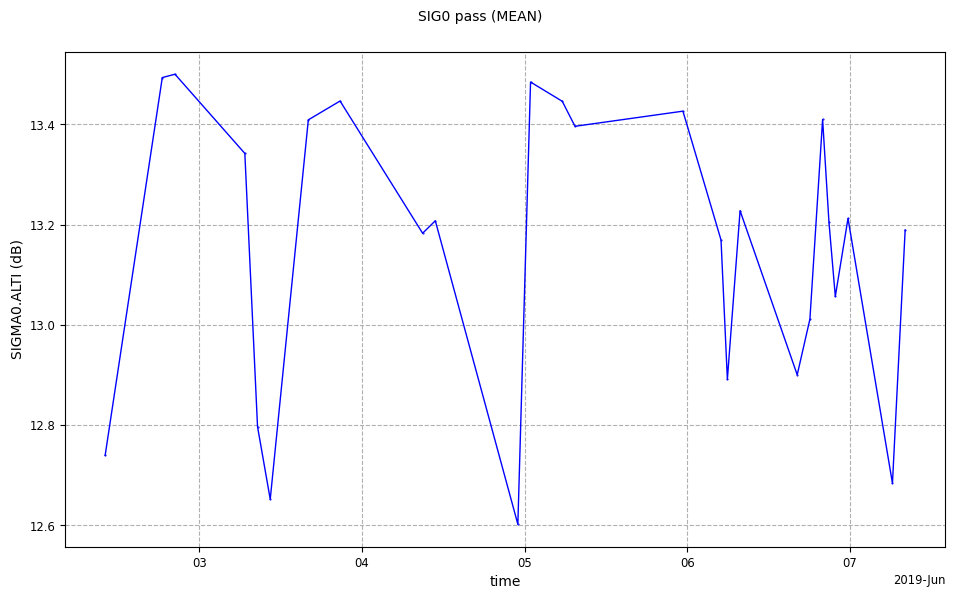
set_data_params() method on an existing plot.Data limits & NaN removal
Tip
Removing numpy.nan values allows to visually join points separated by numpy.nan values on plots represented as curves.
from casys import CasysPlot, DataParams, DateHandler

param = DataParams(
    x_limits=(
        DateHandler("2019/06/02T07:00:00"),
        DateHandler("2019/06/07T08:30:00")
    ),
    y_limits=(12.5, 13.5),
    remove_nan=True
)

plot = CasysPlot(
    data=ad,
    data_name="SIG0 pass",
    stat="mean",
    data_params=param
)
plot.show()
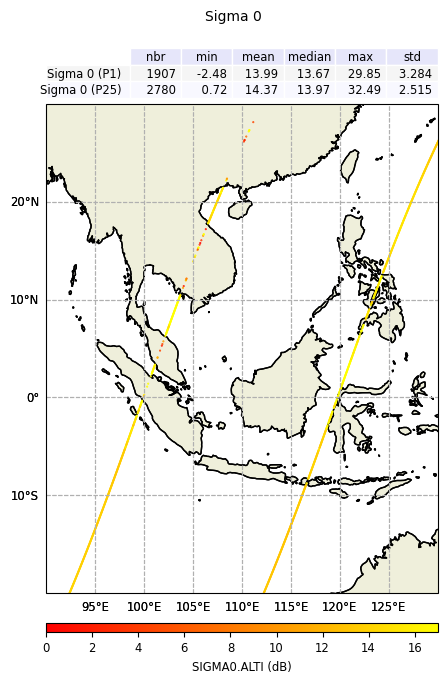
from casys import CasysPlot, DataParams, DateHandler, PlotParams, TextParams

plot_par = PlotParams(
    fig_width=5.5,
    fig_height=6.8,
    color_limits=(0, 17),
    x_limits=(90, 130),
    y_limits=(-20, 30),
    color_bar=False,
    color_map="autumn",
)

pass_1 = (
    DateHandler.from_orf("C_J3_GDRD", 122, 1, pos="first"),
    DateHandler.from_orf("C_J3_GDRD", 122, 1, pos="last"),
)

pass_25 = (
    DateHandler.from_orf("C_J3_GDRD", 122, 25, pos="first"),
    DateHandler.from_orf("C_J3_GDRD", 122, 25, pos="last"),
)

plot_1 = CasysPlot(
    data=ad,
    data_name="Sigma 0",
    plot="map",
    plot_params=plot_par,
    data_params=DataParams(time_limits=pass_1),
    text_params=TextParams(legend=f"Sigma 0 (P1)"),
)

plot_2 = CasysPlot(
    data=ad,
    data_name="Sigma 0",
    plot="map",
    plot_params=plot_par,
    data_params=DataParams(time_limits=pass_25),
    text_params=TextParams(legend=f"Sigma 0 (P25)"),
)

# Adding stats for each plot
plot_1.add_stat_bar()
plot_2.add_stat_bar()

# Merging plots
plot_1.add_color_bar()
plot_1.add_plot(plot_2)

plot_1.show()
Transforming and centering Data
center and transform parameters
in the DataParams given to CasysPlot
(via the data_params parameter).center parameter is used for simple centering operations, while the transform parameter can be
used for more complex operations, like scaling or applying a function.Center the plot data.
Parameters
----------
center
Value, clip like str or function to use on the plot data.
Transform the plot data.

Parameters
----------
transform
    Clip like str or function to use on the plot data.
CasysPlot object.Therefore, plot’s elements will be affected by the centering operation:
colorbar
statistic bar
histogram bar
statistic graph
center/transform value are available
in the attributes of the CasysPlot.data_used attribute.Center parameter
Possible values for the center parameter are:
a float/int (ex
10.5) ->ctrd_data = data - 10.5a statistic name (ex
"mean") ->ctrd_data = data - mean(data)
10.5.from casys import create_image_grid
plot_par = PlotParams(color_limits="auto")
plot_1 = CasysPlot(
data=ad,
data_name="Ku-band range std fct (swh, wind_speed)",
stat="median",
plot_params=plot_par,
)
plot_1.add_stat_bar(position="bottom")
plot_1.add_stat_graph(for_axis="x", position="bottom")
plot_1.add_hist_bar(for_axis="z")
plot_2 = CasysPlot(
data=ad,
data_name="Ku-band range std fct (swh, wind_speed)",
stat="median",
data_params=DataParams(center=10.5),
plot_params=plot_par,
)
plot_2.add_stat_bar()
plot_2.add_stat_graph(for_axis="x", position="top")
plot_2.add_hist_bar(for_axis="z", position="top")
create_image_grid(
figure_size=(15, 11),
plots=[plot_1, plot_2],
columns_nb=1,
)
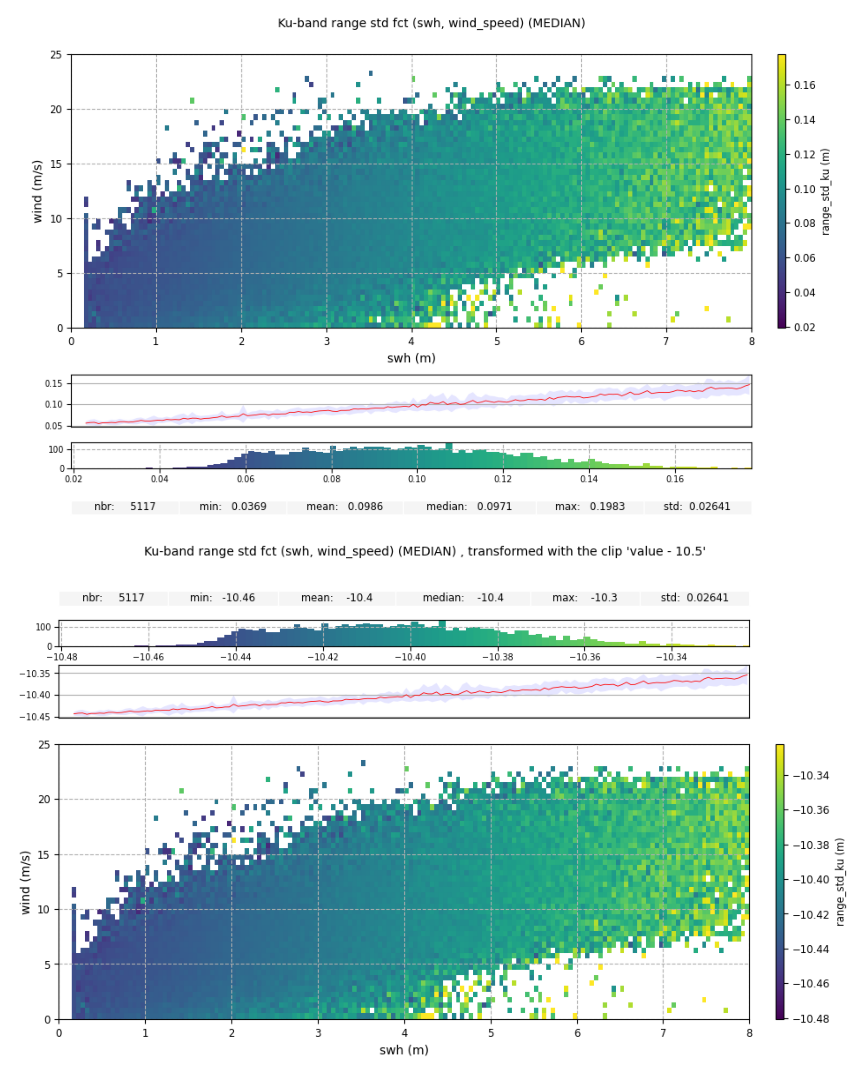
Looking at the attributes of the data_used object:
plot_2.data_used.attrs
{'initial_stats': {MIN: np.float64(0.0369),
  MAX: np.float64(0.1983),
  NBR: 5117,
  MEAN: np.float64(0.09860080125073285),
  MEDIAN: np.float64(0.0971),
  STD: np.float64(0.026405127690720866),
  VAR: np.float64(0.0006972307683632738)},
 'transform': 'value - 10.5',
 'transformed_stats': {MIN: np.float64(-10.4631),
  MAX: np.float64(-10.3017),
  NBR: 5117,
  MEAN: np.float64(-10.401399198749267),
  MEDIAN: np.float64(-10.4029),
  STD: np.float64(0.026405127690720866),
  VAR: np.float64(0.0006972307683632738)}}
"mean".plot = CasysPlot(
data=ad,
data_name="Ku-band range std fct (swh, wind_speed)",
stat="median",
data_params=DataParams(center="mean"),
plot_params=plot_par,
)
plot.add_stat_bar()
plot.add_stat_graph(for_axis="x", position="top")
plot.show()

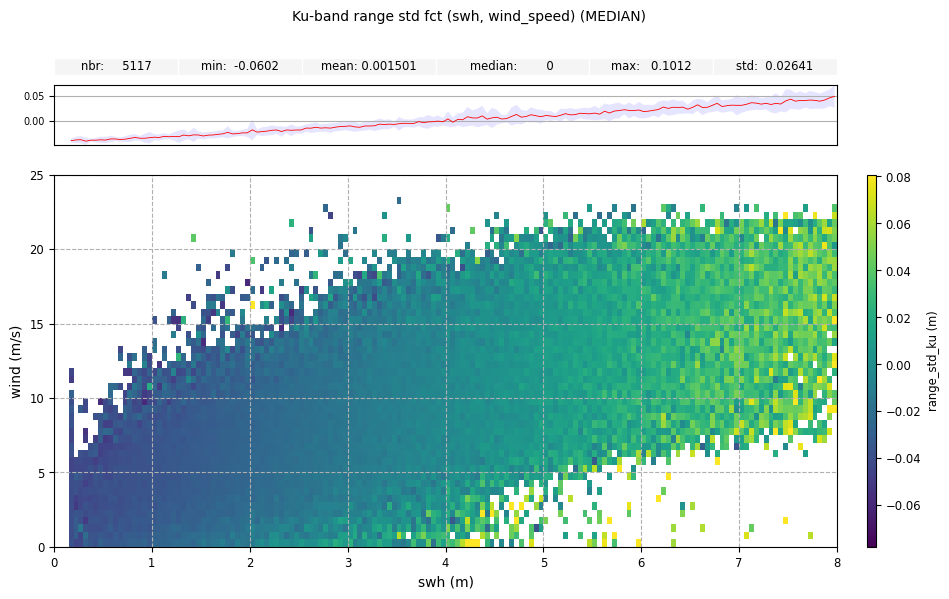
center_data() method
with a statistic name, "median".plot = CasysPlot(
data=ad,
data_name="Ku-band range std fct (swh, wind_speed)",
stat="median",
plot_params=plot_par,
)
plot.center_data(center="median")
plot.add_stat_bar()
plot.add_stat_graph(for_axis="x", position="top")
plot.show()
Transform parameter
Possible values for the transform parameter are:
a callable/function (ex ‘transform_data’)) ->
transf_data = transform_data(data)a CLIP like character chain.
For the last option, the character chain must contain:
the
"VALUE"term at least one time, representing the data to center,arithmetic operations:
"+","-","*","/",statistic names as
"MEAN","MAX","STD","COUNT", …,numerical values :
"10.5".
Note
transform = "vaLue - 3 * STd + 4.3" -> transf_data = data - 3 * std(data) + 4.3.transform = 'scale', equivalent
to transform = "( VALUE - MEAN ) / STD" (-> transf_data = ( data - mean(data) ) / std(data)).center = "mean" is equivalent to
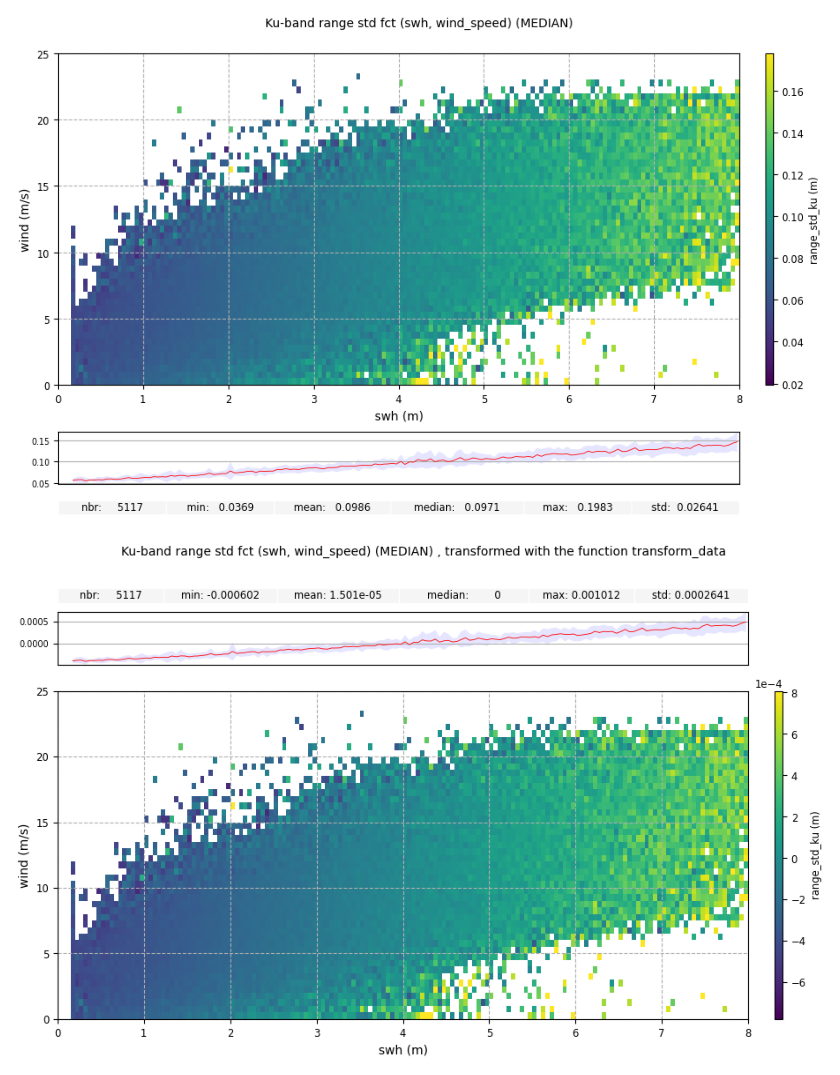
transform = "VALUE - MEAN".transform = transform_data.import numpy as np
def transform_data(data):
return (data - np.nanmedian(data)) / 100
plot_1 = CasysPlot(
    data=ad,
    data_name="Ku-band range std fct (swh, wind_speed)",
    stat="median",
    plot_params=plot_par,
)
plot_1.add_stat_bar(position="bottom")
plot_1.add_stat_graph(for_axis="x", position="bottom")

plot_2 = CasysPlot(
    data=ad,
    data_name="Ku-band range std fct (swh, wind_speed)",
    stat="median",
    data_params=DataParams(transform=transform_data),
    plot_params=plot_par,
)
plot_2.add_stat_bar()
plot_2.add_stat_graph(for_axis="x", position="top")

create_image_grid(
    figure_size=(15, 11),
    plots=[plot_1, plot_2],
    columns_nb=1,
)
data_used object, the "transform"
key contain the function representation:print(plot_2.data_used.attrs["transform"])
def transform_data(data):
    return (data - np.nanmedian(data)) / 100
transform = "( VALUE - MEDIAN ) / 100".plot = CasysPlot(
data=ad,
data_name="Ku-band range std fct (swh, wind_speed)",
stat="median",
data_params=DataParams(transform="( VALUE - MEDIAN ) / 100"),
plot_params=plot_par,
)
plot.add_stat_bar()
plot.add_stat_graph(for_axis="x", position="top")
plot.show()

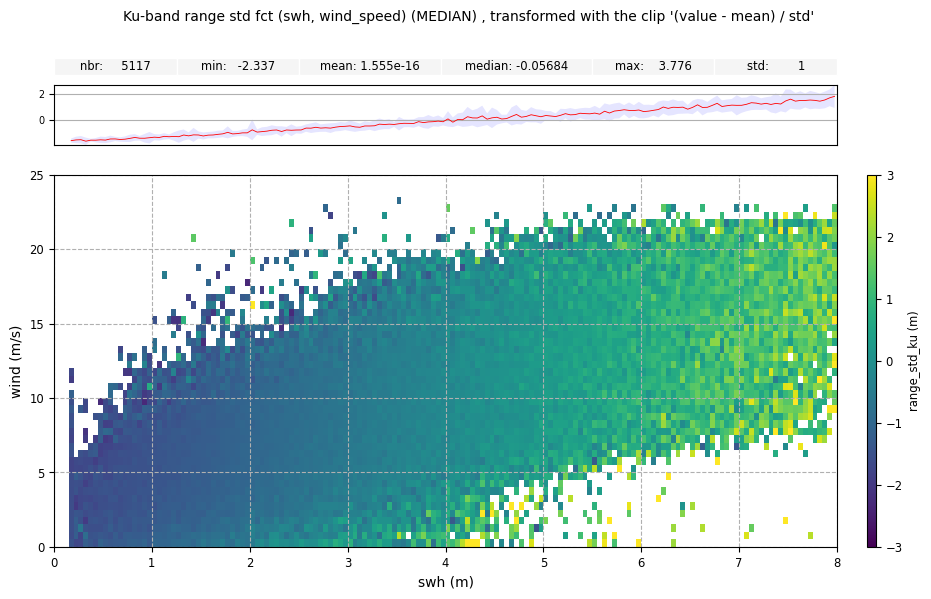
transform = "scale".plot = CasysPlot(
data=ad,
data_name="Ku-band range std fct (swh, wind_speed)",
stat="median",
data_params=DataParams(transform="scale"),
plot_params=plot_par,
)
plot.add_stat_bar()
plot.add_stat_graph(for_axis="x", position="top")
plot.show()
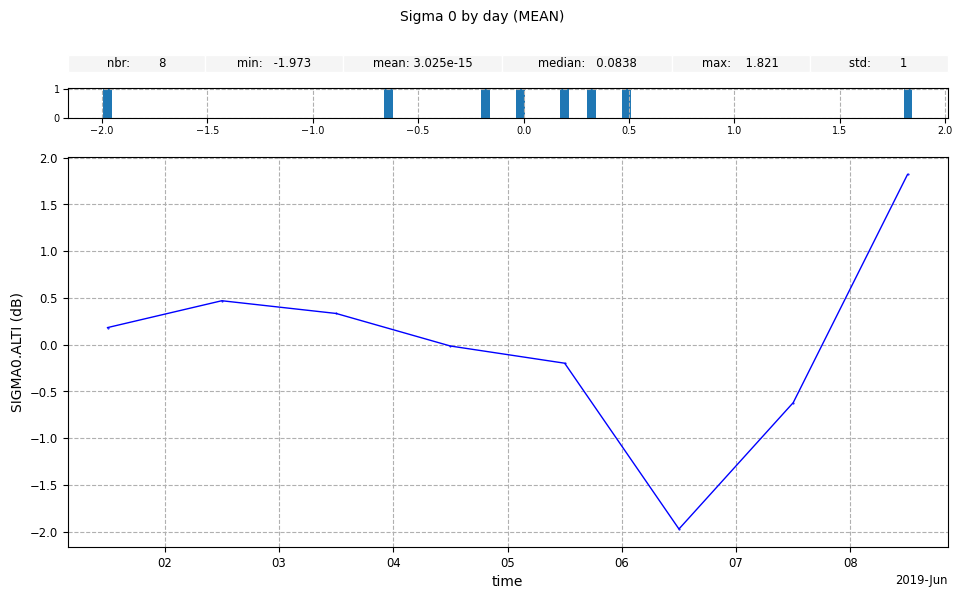
transform_data() method
with "scale".plot = CasysPlot(
data=ad,
data_name="Sigma 0 by day",
stat="mean",
plot_params=plot_par,
)
plot.transform_data(transform="scale")
plot.add_stat_bar()
plot.add_hist_bar(position="top")
plot.show()