Basic examples
Basic downloadable notebook examples of diagnostics available in Casys Tools.

Raw data
Raw data comparison
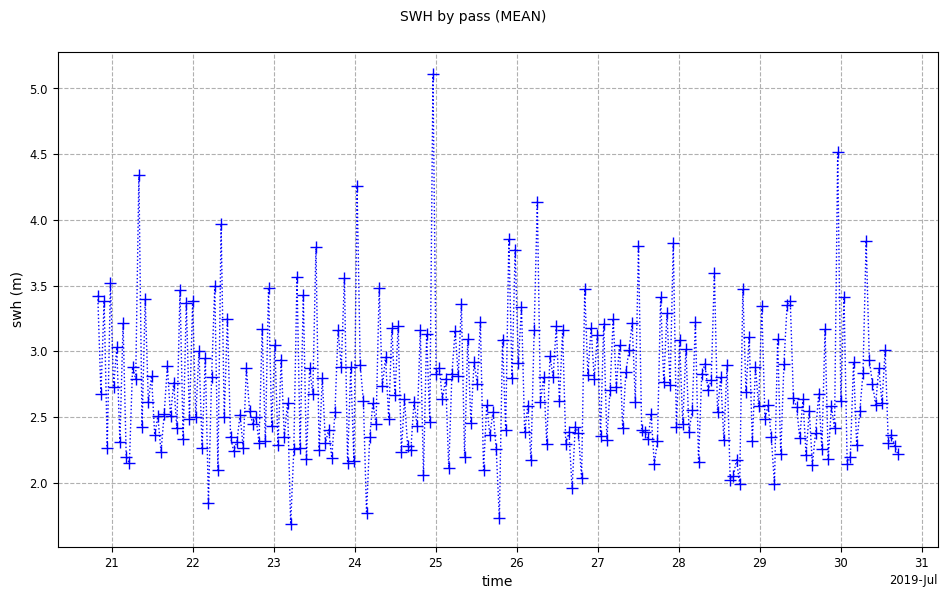
Temporal evolution of SWH

Geographical box statistic on mean SWH

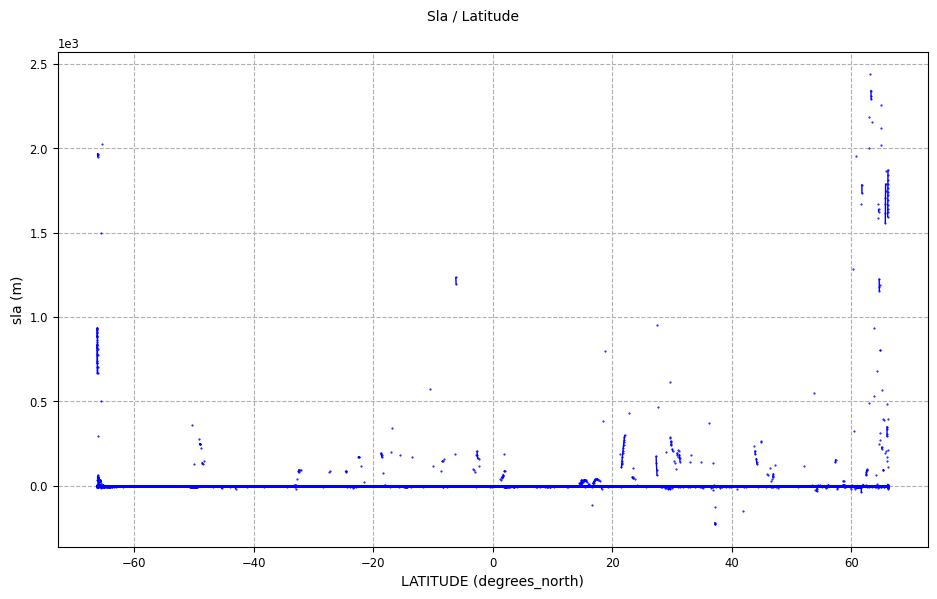
Histogram on SLA

Scatter Ku-band Range std / C-band Range std

Binned Statistic with 1D and 2D

Crossovers Nadir

Crossover Swath

Crossover Swath/Nadir

Periodogram

Spectral Analysis - Nadir

Spectral Analysis - Swath

Editings

Ratio of rejected points

Missing Points