AxeParams
AxeParams is an object allowing to customize axes
from different elements of plots.Axe parameters for a plot.
Matplotlib underlying functions depend on the type of element this parameter is
given to.
Parameters
----------
label
Label properties of the axe.
https://matplotlib.org/stable/api/_as_gen/matplotlib.axes.Axes.set_xlabel.html
https://matplotlib.org/stable/api/_as_gen/matplotlib.axes.Axes.set_ylabel.html
https://matplotlib.org/stable/api/table_api.html#matplotlib.table.Cell.set_text_props
https://matplotlib.org/stable/api/colorbar_api.html
-> set_label(self, label, **kw)
ticks
Ticks properties of the axe:
https://matplotlib.org/stable/api/_as_gen/matplotlib.axes.Axes.tick_params.html
Applies to both minor and major ticks.
ticks_minor
Ticks properties of the axe:
https://matplotlib.org/stable/api/_as_gen/matplotlib.axes.Axes.tick_params.html
Applies to minor ticks.
ticks_major
Ticks properties of the axe:
https://matplotlib.org/stable/api/_as_gen/matplotlib.axes.Axes.tick_params.html
Applies to major ticks.
values
Additional major ticks parameters of the axe, can be a dictionary or a function
transforming a value to a label.
{"ticks": [2, 30, 50, 100], "labels":["one","two","three","four"]}
If a dictionary is provided, it has to include two keys:
- labels (for x/y axes)
https://matplotlib.org/stable/api/_as_gen/matplotlib.axes.Axes.set_xticklabels.html
https://matplotlib.org/stable/api/_as_gen/matplotlib.axes.Axes.set_yticklabels.html
- ticks (for x/y axes)
https://matplotlib.org/stable/api/_as_gen/matplotlib.axes.Axes.set_xticks.html
https://matplotlib.org/stable/api/_as_gen/matplotlib.axes.Axes.set_yticks.html
- ticks (for colorbar axes)
https://matplotlib.org/stable/api/colorbar_api.html#matplotlib.colorbar.ColorbarBase.set_ticks
position
Position of the axe.
kwargs
Additional parameters passed to the underlying matplotlib class.
enabled
Whether this AxeParams is enabled or not.
is_copy
Whether this AxeParams represent a copied axis or not.
user ones (internal usage)
level
Property level to use.
List of matplotlib underlying functions:
label:
Matplotlib.table -> set_text_props
Matplotlib.colorbar -> set_label
ticks:
values:
labels : Axes property. Corresponding Matplotlib properties are:
ticks : Axes or colorbar property. Corresponding Matplotlib properties are:
AxeParams might be used to configure:
color bar
statistics bar
axes
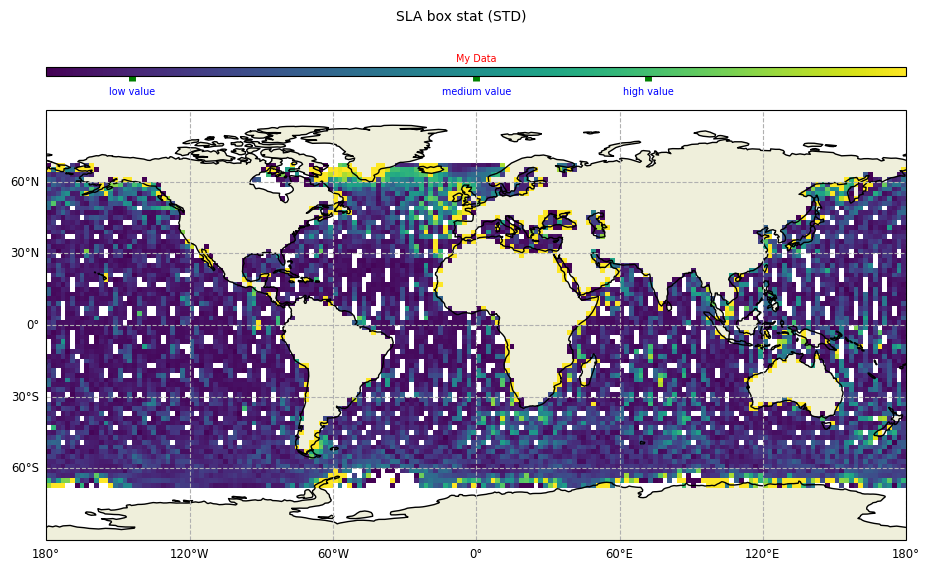
Color bar
from casys import AxeParams

param = AxeParams(
    label={
        "label": "My Data",
        "fontsize": "x-small",
        "color": "red"
    },
    ticks={
        "labelsize": "x-small",
        "labelcolor": "blue",
        "colors": "green",
        "width": 5,
    },
    values={
        "ticks": [0.1, 0.5, 0.7],
        "labels": ["low value", "medium value", "high value"],
    },
)
Color bar can be set in PlotParams.
from casys import CasysPlot, PlotParams

plot = CasysPlot(
    data=ad,
    data_name="SLA box stat",
    stat="std",
    plot_params=PlotParams(color_bar=param, color_limits=(0, 1)),
)
plot.show()

Or via the add_color_bar() method.
plot.add_color_bar(position="top")
plot.show()
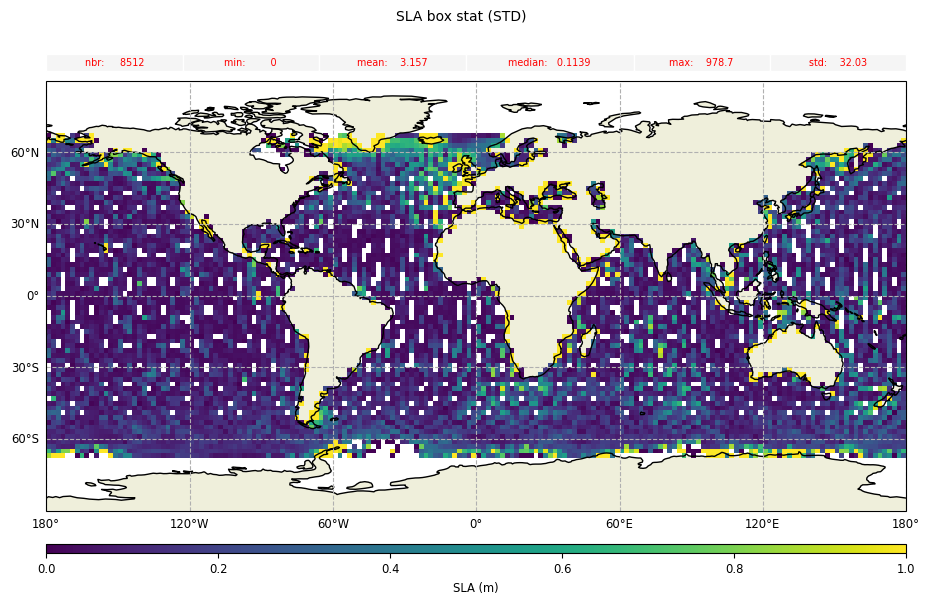
Statistics bar
Through the add_stat_bar() method.
from casys import AxeParams, CasysPlot

plot = CasysPlot(
    data=ad,
    data_name="SLA box stat",
    stat="std",
    plot_params=PlotParams(color_limits=(0, 1)),
)

params = AxeParams(
    label={
        "label": "My Stat Data",
        "fontsize": "x-small",
        "color": "red"
    },
    position="bottom"
)

plot.add_stat_bar(params=params, position="top")
plot.show()
Axes
Through the set_ticks() method.
from casys import CasysPlot, AxeParams

ticks_params = AxeParams(
    label={
        "label": "Label pass number",
        "color": "b"
    },
    ticks={
        "labelrotation": 40,
        "labelcolor": "blue",
        "color": "b",
        "width": 5,
    },
    position="bottom",
)

plot = CasysPlot(data=ad, data_name="SIG0 pass", stat="mean")

plot.set_ticks(params=ticks_params)
plot.show()

Additional usage examples can be found in this notebook.