Events
A
CasysEvent is a vertical line or range
that can be added on a graph to represent an event at a given time or over a given
time period.Representation of an event that can be added to CasysPlot data.
Parameters
---------
start
x position of the start of the event (as a float or ong_dh.DateHandler)
end
x position of the end of the event (as a float or ong_dh.DateHandler)
label
Label name and properties of the event (optional)
Underlying function:
https://matplotlib.org/stable/api/_as_gen/matplotlib.axes.Axes.text.html
params
Additional parameters to pass to the matplotlib functions
* Axes.axvline for simple events
https://matplotlib.org/stable/api/_as_gen/matplotlib.axes.Axes.axvline.html
* Axes.axvspan for range events
https://matplotlib.org/stable/api/_as_gen/matplotlib.axes.Axes.axvspan.html
There are two types of events:
SimpleEvent: represented as a vertical line at the given abscissa
RangeEvent: represented as two vertical lines delimiting an area between the given abscissa
They can be added to plots using the
add_event() method and removed with the
remove_events() one.Add an event to the plot.
Parameters
----------
event
the event to add
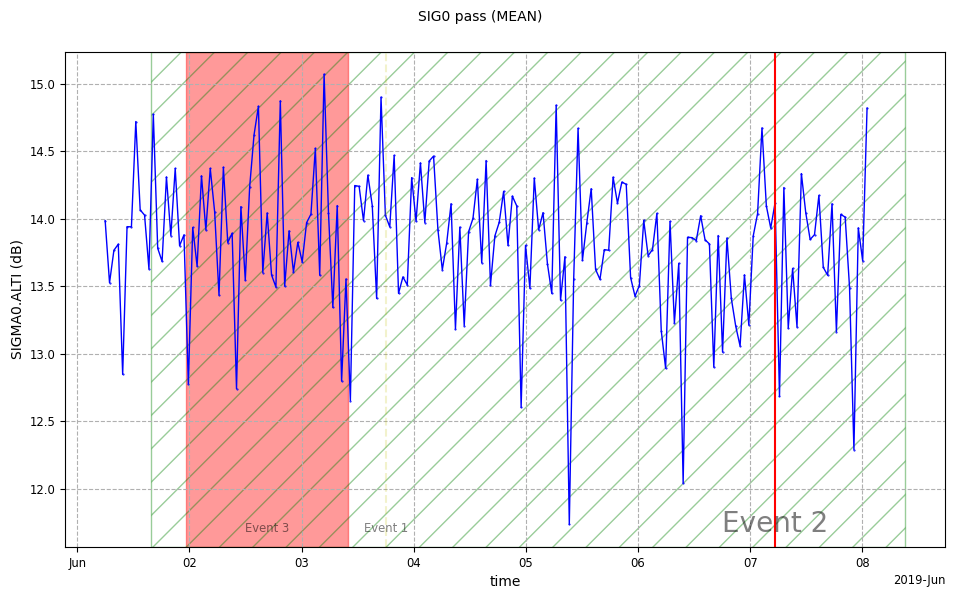
Simple events
from casys import CasysPlot, DateHandler, SimpleEvent, RangeEvent

plot = CasysPlot(data=ad, data_name="SIG0 pass", stat="mean")

d1 = DateHandler("2019/06/03T18:00:00")
d2 = DateHandler.from_orf("C_J3_GDRD", 122, 154, pos="equator")

event_1 = SimpleEvent(
    start=d1,
    label="Event 1",
    params={"color": "y", "alpha": 0.2, "linestyle": "--"}
)
event_2 = SimpleEvent(
    start=d2,
    label={"s": "Event 2", "fontsize": 20}
)

plot.add_event(event_1)
plot.add_event(event_2)

plot.show()
Range events
event3_start = DateHandler.from_orf("C_J3_GDRD", 122, 20, pos="first")
event3_end = DateHandler.from_orf("C_J3_GDRD", 122, 56, pos="last")

event4_start = DateHandler.from_orf("C_J3_GDRD", 122, 12, pos="first")
event4_end = DateHandler.from_orf("C_J3_GDRD", 122, 254, pos="last")

event_3 = RangeEvent(
    start=event3_start,
    end=event3_end,
    label="Event 3"
)
event_4 = RangeEvent(
    start=event4_start,
    end=event4_end,
    params={"fill": False, "hatch": "/", "color": "g"}
)

plot.add_event(event_3)
plot.add_event(event_4)

plot.show()