


From antiquity to the space age
Early sea-farers on the trades routes were the first to gauge the velocity and direction of currents, such as in the Red Sea and the Mediterranean. The Vikings crossed the North Atlantic around the year 1000, but only in the early Renaissance did Portuguese, Spanish, British and French expeditions begin systematically exploring the seas. The scale of the ocean planet started to become apparent.
To shorten the journey from New York to London, Benjamin Franklin was the first to chart ocean currents in the Atlantic. In 1777, he mapped the Gulf Stream by measuring water temperature. Franklin recommended that captains carrying mail between America and Europe follow the Gulf Stream to save time.
In 1849, Matthew Maury published the first worldwide wind and current maps from data gathered by ships. The first purely oceanographic experiment was conducted in 1872: for 42 months, the Challenger expedition systematically explored the oceans, collecting data from the sea surface down to the seafloor, such as bathymetry (depth soundings), temperature and current data. This information laid the foundations for modern oceanography.
The epoch of space geodesy : promising beginnings by laser and Doppler measurements
At a global scale, in 1957, the Earth is an unknown planet. The creation of the International Geophysical Year (AGI) in 1957-1958 will fill this gap. Its goal was to measure the parameters (such as the Earth's hemispheric asymmetry) to get a first overview of some basic phenomena.
1957 is also the year of the first artificial satellite which we have just celebrated the fiftieth anniversary. Beyond the political strategies during its launch, Sputnik showed a new exploration way : the space.
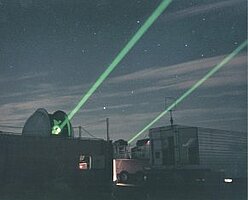
An initial exploration phase begins in the 60's when geodetic satellites measure the first orbit calculated from distance measurements by laser telemetry. This calculation of orbital trajectory parameters will soon be doubled with the use of the Doppler shift.
The advent of satellite altimetry
The feasibility of a new discipline as space oceanography by radar instrumentation is discussed at the congress of Williamstown in 1969.
Thus, the satellite altimetry is initially designed to measure the sea level by a combination of radar technique (used to measure the distance from the satellite to a reflecting surface) and a positioniing technique (allowing a very precise location of the satellite on its orbit).
First altimetry measurements will follow to determine the ocean surface topography. The first country to fly a satellite-borne altimeter was the United States, with the Skylab and Geos3 missions, Seasat in 1978 (the first satellite to provide usable - and useful - data) and <link html missions geosat_uk.html>Geosat in 1985. Esa materializes the launch of ERS-1 in 1991 : successively implemented on 3 different orbits, it contains several instruments including a radar altimeter.
In 1981 Cnes was evaluating Poseidon, an altimeter which was to be carried on the first Spot satellite. At the same time, Nasa, which wanted to further the achievement - albeit brief - of Seasat, was planning the Topex (Topography Experiment) mission. However, neither agency had the budget to carry out this kind of mission alone. In 1983, they began discussing the possibility of combining their two projects.
In 1987, Cnes and Nasa formally created a partnership for a joint project involving French and American instruments, on an American satellite to be launched by a European rocket (Ariane 4): this was to become Topex/Poseidon.
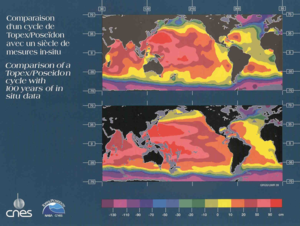
Global Ocean observation is one of its assets : ten days of Topex/Poseidon satellite measurements provide more details than in-situ observations over the last hundred years. The increasing quality of the data (with reprocessing measurements), the continuity and homogeneity of data over more than 13 years, the scientific, technical and human collaboration, has helped to the success of this mission.
Soprane ocean model in the Atlantic northeast: the data assimilation at each pass of the satellite Topex/Poseidon, improves the model. Click on the image to see the animation (19.3Mo). Credits SHOM/CLS.
Combination of satellites
During the Topex/Poseidon mission, new altimetry missions are launched : ERS-2 (1995), GFO (1998), Jason-1 (2001) and Envisat (2002).
The combination of several satellites enables high-precision altimetry and to reduce to silence the compromise : spatial resolution versus temporal resolution. Topex/Poseidon-ERS and Jason-Envisat are fine examples of how altimetry satellites can operate together.
These missions are part of international oceanographic and meteorological programmes, such as Woce and Toga, both linked to the WCRP.
It's already tomorrow with operational oceanography
More and more faster processing systems allowed altimetry data in near real-time.Their assimilation into models, in combination with other data (in-situ, water temperature, salinity, etc.) has helped operational altimetry. Mercator Ocean has issued its first ocean bulletin for the North Atlantic on January 17, 2001.
After more than 15 years of progress in altimetry, it is necessary to continue and to confirm all efforts to ensure a sufficient spatial resolution for mesoscale observation and operational applications. Thus the existence of at least two altimetry satellites in working order is needed for meseoscale observation. For operational applications, three, or even better, four, operational satellites are required.
The story continues: new results are obtained each day, the topics are diversifying, such as in hydrology on monitoring variations in lake levels (or rivers or wetlands), or in glaciology where altimetry brings its contribution to determine sea ice thickness or periods of freeze...
Further information :
- Missions from Geosat to future altimetry missions.
- Products last updates :
- Newsletter #10, Ssalto/Duacs, multi-missions altimeter products, G. Dibarboure and al.
- Informations on products last updates.
- External website, Le club des Argonautes : An article summarizing forty years of spatial research on altimetry (in french).