


High-precision altimetry with satellites working together
In many ways, the orbit of an altimetry satellite is a compromise. But one point that deserves special attention is getting the right balance between spatial and temporal resolution: a satellite that revisits the same spot frequently covers fewer points than a satellite with a longer orbital cycle. One solution is to operate several satellites together.
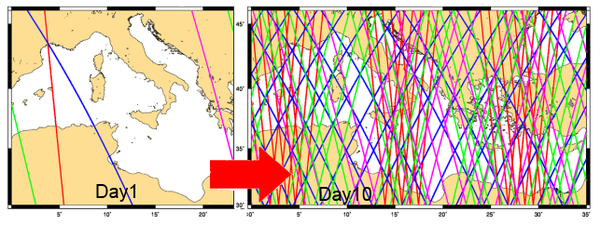
Grounds tracks for the 4 operational satellites on June 2015, over the Mediterranean Sea: Jason-2 ground tracks are blue, Saral/altiKa are green, Cryosat-2 are red and HY-2A are pink.
Download the animation (.avi format) where the ground tracks are displaying (and are cumulating) for each satellite and over a 10-day period (Jason-2 cycle) with a 1-hour delay between each frame. Days are written on the top of the maps with the units "Julian Days". The day for the first map (23 921) corresponds to 30 June 2015. Credits Cnes/CLS.
On February 2012, a new 4-satellite configuration is available with the ingestion of the Cryosat-2 data flows in the Duacs multimission system (Jason-1; Envisat, Jason-2 and Cryosat-2 ). It allows more along-track data for model assimilation, higher resolution of multi-mission mesoscale maps and better resilience of the multi-mission observation system if an old altimeter becomes unavailable
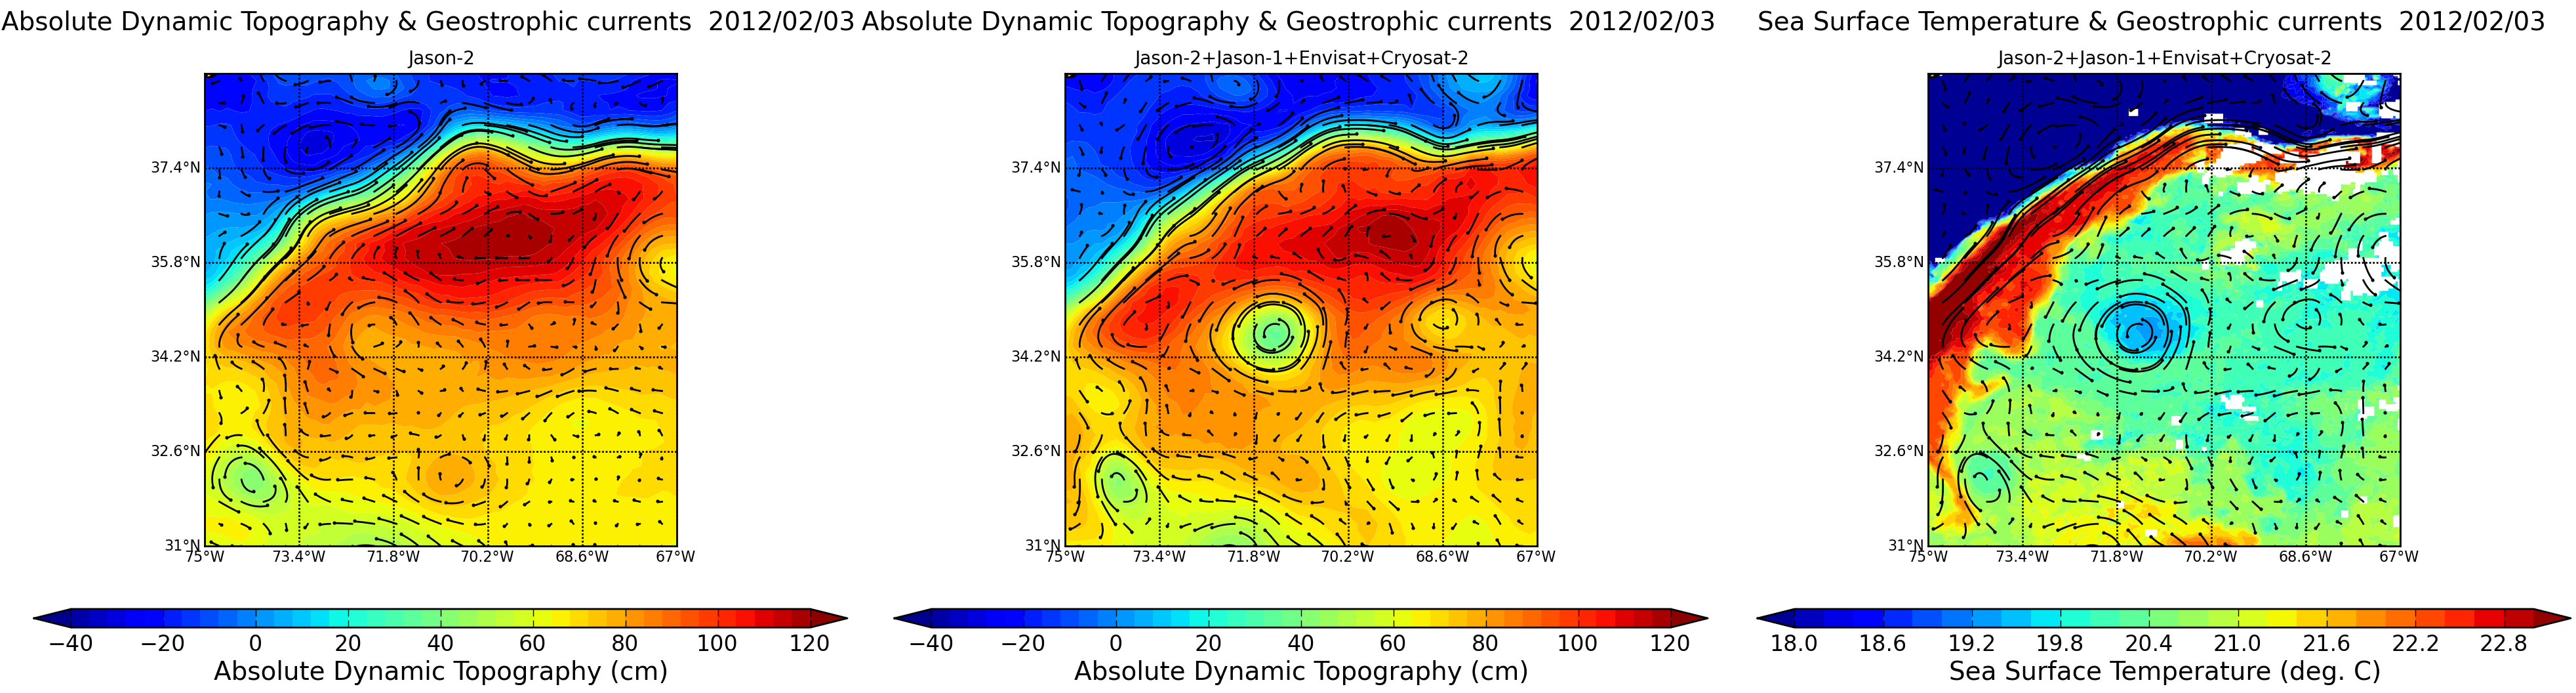
Maps of Absolute Dynamic Topography (in m) superimposed to absolute geostrophic currents (m/s) in the Atlantic Ocean on 2012/02/03 made from Jason-2 (left) and Jason-1+Envisat+Jason-2+Cryosat-2 (middle). Sea Surface Temperature- SST (in °C, right) superimposed to geostrophic currents. Merging of the four satellite data shows eddy (near 71.8°W, 34.2°N) that are invisible, or just barely visible with only one satellite and much better sorted out with four of them. The SST map shows the same eddy which corroborates the findings of the altimetry (Credits CLS/Cnes).
Topex/Poseidon-ERS and Jason-Envisat are fine examples of how altimetry satellites can operate together. Topex/Poseidon and Jason-1 follow a repeat cycle of ten days designed to monitor ocean variations, so they pass over the same points fairly frequently but their ground tracks are some 315 kilometers apart at the equator-more than the average span of an ocean eddy. On the other hand, ERS-2 and Envisat only revisit the same point on the globe every 35 days but the maximum distance between two tracks at the equator is just 80 kilometers.
Sea level anomaly maps over the Mediterranean on June 11, 2003, made from Jason-1 + ERS-2 (top) and Jason-1+ERS-2+T/P+GFO (bottom). Merging of the four satellite data shows eddies (circles) that are invisible, or just barely visible with two satellites and much better sorted out with four of them. (Credits MFS/CLS).
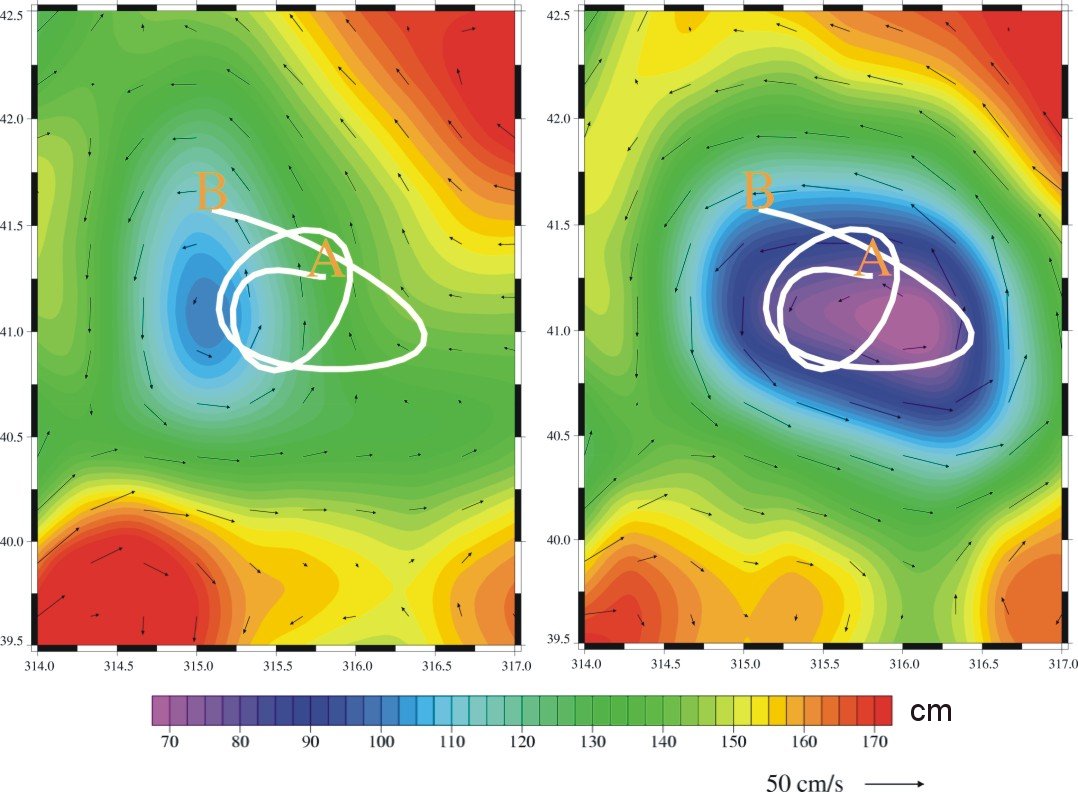

Buoy trajectory (white line, from 14 to 28 May 2003, from A to B) and merged absolute dynamic topography in the Gulf Stream on 21 May 2003. Left with 'only' two satellites, right with four satellites. The left-hand map corresponds more closely to the eddy revealed by the buoy's path. (Credits CLS).
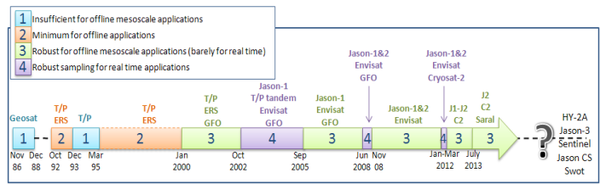
At least two altimetry satellites are required to map the ocean and monitor its movements precisely, particularly at scales of 100 to 300 kilometres (mesoscale). With four altimetry satellites available (Jason-1+Jason-2+Envisat+Crysaot-2 from 2012, or Jason-1, Envisat or ERS-2, Topex/Poseidon and GFO between 2002-2005), the resolution of sea surface height measurements is greatly enhanced. At least three satellites are needed to observe eddies and mesoscale phenomenon.
Further information :
- Ssalto/Duacs multimission altimetry products
- Image of the month
- September 2006 : Merging of altimetry data: proofs from other measurements.
- September 2004 : Four satellites to watch over the Mediterranean.
- Newsletter #9, 2003 : Two altimetric satellites minimum are needed for ocean observation and forecasting, V. Rosmorduc et al.