Click here to download this notebook.
Crossovers monitoring
[2]:
from casys.readers import CLSTableReader

from casys import CasysPlot, DateHandler, Field, NadirData, PlotParams

NadirData.enable_loginfo()
[3]:
# Reader definition
table_name = "TABLE_C_J3_B_GDRD"
orf_name = "C_J3_GDRD"
cycle_number = 122
start = DateHandler.from_orf(orf_name, cycle_number, 1, pos="first")
end = DateHandler.from_orf(orf_name, cycle_number, 154, pos="last")

reader_j3 = CLSTableReader(
    name=table_name,
    date_start=start,
    date_end=end,
    orf=orf_name,
    time="time",
    longitude="LONGITUDE",
    latitude="LATITUDE",
)

# Data container definition
ad_j3 = NadirData(source=reader_j3)

var_sla = Field(
    name="sla",
    source="ORBIT.ALTI - RANGE.ALTI - MEAN_SEA_SURFACE.MODEL.CNESCLS15",
    unit="m",
)
Using the add_crossover_stat method:
[4]:
# Statistics definition and calculation
ad_j3.add_crossover_stat(
    name="Crossover SLA",
    field=var_sla,
    max_time_difference="5 days",
    jump_threshold=1.9,
    geobox_stats=["mean", "count"],
    temporal_stats=["mean", "count", "var"],
    temporal_stats_freq=["cycle", "day"],
)

ad_j3.compute()
2025-05-14 10:56:06 INFO    Reading ['LONGITUDE', 'LATITUDE', 'sla', 'time']
2025-05-14 10:56:08 INFO    Computing diagnostics ['Crossover SLA']
2025-05-14 10:56:09 INFO    Computing done.
A jump threshold of 1.9 will prevent having crossovers inside holes of one measure or more.
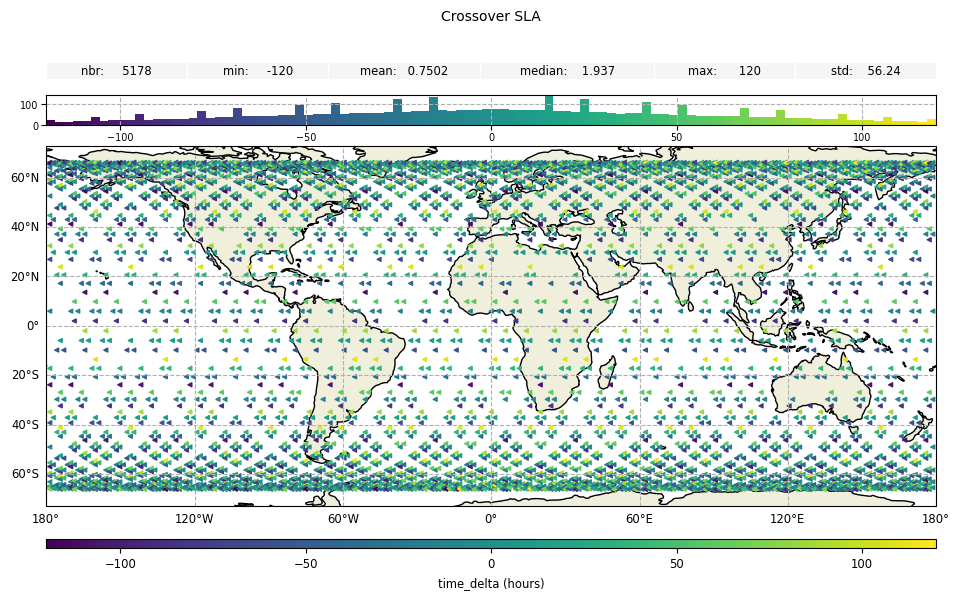
Time differences between arcs
[5]:
cross_delta_plot = CasysPlot(
    data=ad_j3,
    data_name="Crossover SLA",
    delta="time",
    plot_params=PlotParams(marker_size=8, marker_style="<"),
)

cross_delta_plot.add_hist_bar(position="top")
cross_delta_plot.add_stat_bar(position="top")

cross_delta_plot.show()
[5]:
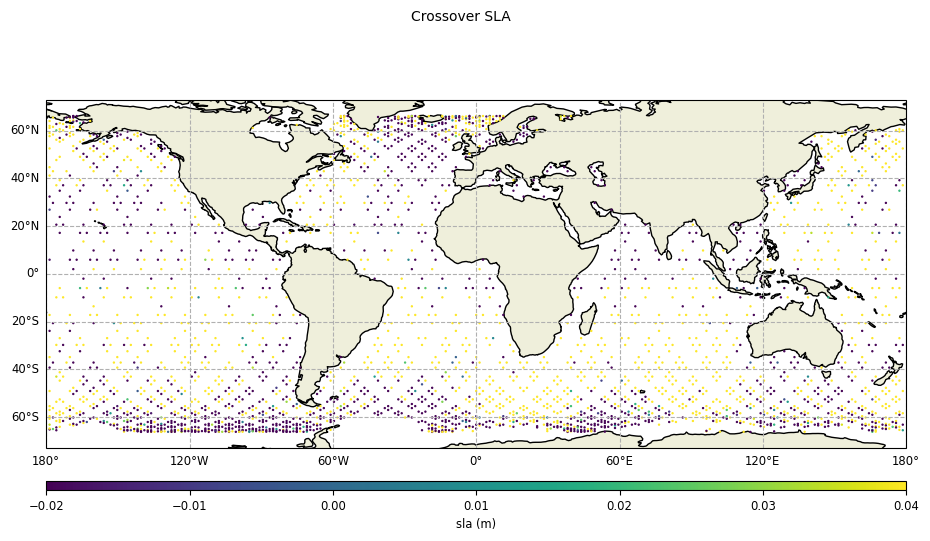
SLA differences between arcs
[6]:
cross_delta_plot = CasysPlot(
    data=ad_j3,
    data_name="Crossover SLA",
    delta="field",
    plot_params=PlotParams(marker_size=2, color_limits=(-0.02, 0.04)),
)

cross_delta_plot.show()
[6]:
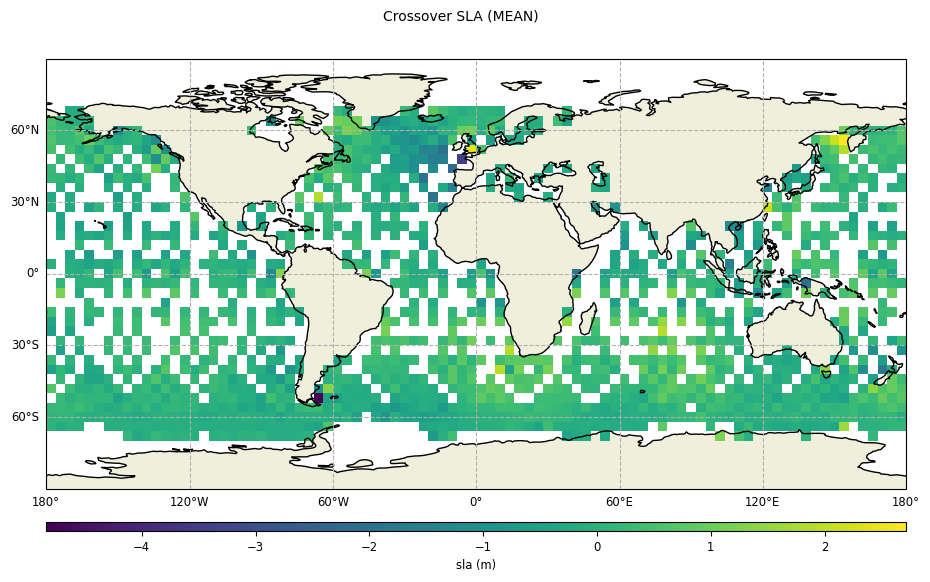
Geographical box statistics of SLA differences
[7]:
sla_cross_mean_plot = CasysPlot(data=ad_j3, data_name="Crossover SLA", stat="mean")
sla_cross_mean_plot.show()
[7]:
Along time statistics of SLA differences
[8]:
sla_cross_mean_plot = CasysPlot(
    data=ad_j3, data_name="Crossover SLA", freq="day", stat="mean"
)
sla_cross_mean_plot.show()
[8]:

Multi-mission J3/S3A crossovers of Sigma 0 differences
[9]:
# Definition of the second mission data source
reader_s3a = CLSTableReader(
    name="TABLE_C_S3A_B",
    date_start=DateHandler("2019-06-01 05:30:29"),
    date_end=DateHandler("2019-06-07 05:47:33"),
    orf="C_S3A",
    time="time",
    longitude="LONGITUDE",
    latitude="LATITUDE",
)

ad_s3a = NadirData(source=reader_s3a)

sig0 = Field("SIGMA0_NUMBER.ALTI")

# Statistics definition and calculation
ad_j3.add_crossover_stat(
    name="Crossovers Sigma 0 J3/S3A",
    field=sig0,
    max_time_difference="5 days",
    jump_threshold=2.9,
    stats=["mean", "count"],
    temporal_stats_freq=["cycle", "day"],
    data=ad_s3a,
)

ad_j3.compute()
2025-05-14 10:56:11 INFO    Reading ['LONGITUDE', 'LATITUDE', 'SIGMA0_NUMBER.ALTI', 'time']
2025-05-14 10:56:13 INFO    Computing diagnostics ['Crossovers Sigma 0 J3/S3A']
2025-05-14 10:56:16 INFO    Computing done.
A jump threshold of 2.9 will prevent having crossovers inside holes of two measure or more.
[10]:
plot = CasysPlot(data=ad_j3, data_name="Crossovers Sigma 0 J3/S3A", delta="time")

plot.show()
[10]:
