


Altimetric views of a typhoon
Image of the Month - August 2007
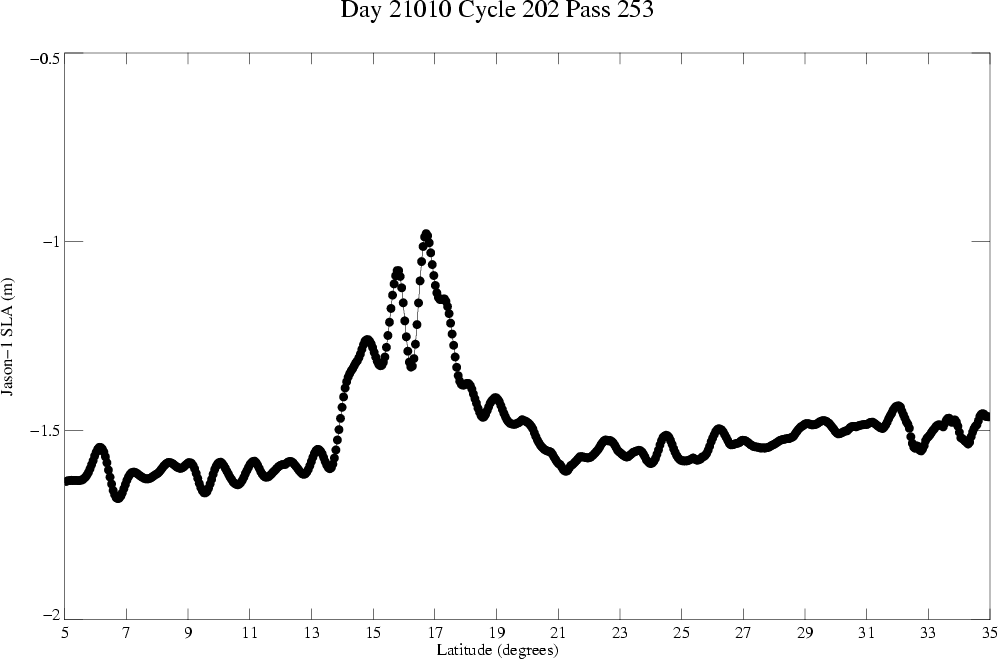
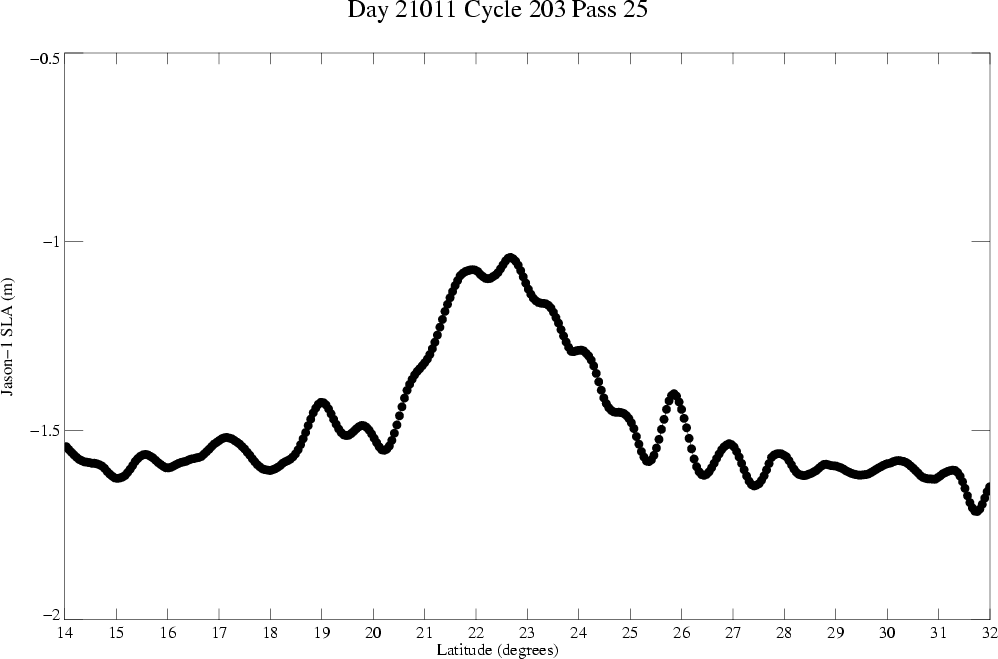
Sea level anomalies due to the effects of atmosphere on the sea surface, as measured by Jason-1 over the Man-Yi typhoon (top left, the plotted Jason-1 ground track overlaid on a significant wave height map at the same time). The typhoon causes a sea surface height increase of about 50 cm (ocean variability has been removed). Specific processing were applied in such extreme cases as cyclones. (Credits CLS)
Man-Yi typhoon struck the Japanese Okinawa island mid-July 2007, with winds blowing at speeds between 230 and 295 km/h. It caused several casualties, as well as important material damage. Typhoons are quite frequent in the region, but they usually appear later in the year; Man-Yi is probably the strongest typhoon ever observed in July. Such meteorological monsters (called cyclones, hurricanes or typhoons depending on the region) feed upon the ocean heat to release a huge quantity of energy. They causes raging winds (winds faster than 33 m/s --118,8 km/h --are a criterion to classify a tropical storm as cyclone), very high waves, torrential rain, and all the damages that follow.
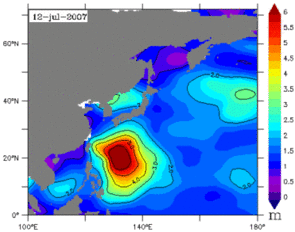
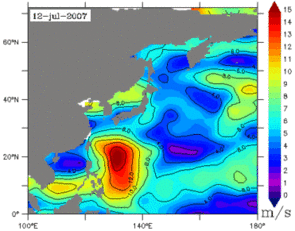
Significant wave heights and wind speed on July 12, 2007.
View the wave height animation: animated gif, flash or avi and the wind speed animation: animated gif, flash or avi between July 7 and 14, 2007
(Credits CLS/Cnes)
Altimetry can be used for cyclone observation, knowledge and forecasting in a number of different ways:
- significant wave height and wind speed measurements on the satellite ground track (that can be more or less close to the cyclone's eye),
- computation of the effects of the atmosphere (pressure and winds) on the sea surface height,
- possibilities of intensification if the cyclone goes over a warm eddy or current.
Last, but not least, altimetry data are assimilated into models, either meteorological (wave height forecasting), or oceanic, the latter making it possible to compute the ocean physical parameters of the ocean-atmosphere exchanges.
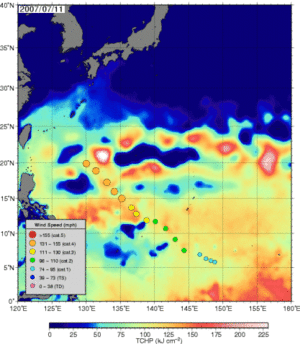
See the TCHP animation between July 5 and 17, 2007: animated gif, flash or avi
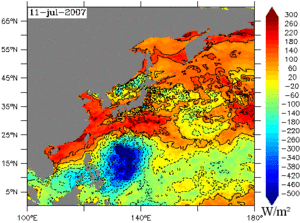
Heat exchanges between atmosphere and ocean, computed by the Mercator ocean forecasting model on July 11, 2007. Blue indicates that the ocean gives heat to the atmosphere, red that the atmosphere warms the ocean. There is a distinct blue area corresponding to the Man-Yi typhoon, which took an enormous quantity of heat from the ocean.
View the animation between July 7 and 18 2007: animated gif, flash or avi
(Credits Mercator Océan)
See also:
- Applications: Marine meteorology and atmospheric studies
- Applications: Hurricane Katrina intensification
- Newsletter Aviso : Using satellite altimetry to identify regions of hurricane intensification, G. Goni et al., Aviso Newsletter 9
Websites on this subject:
References:
- L. Carrère, F. Mertz, J. Dorandeu, Y. Quilfen, L. Chung-Chi, J. Guijarro, 2007, Retrieving extreme low pressure with altimetry, Envisat Symposium 2007, Montreux, Switzerland, April 2007
News
 Archives .
- Aviso Newsletter .
- Search.
- Front-page news.
- Image of the month .
- 2025 .
- 2024 .
- 2023 .
- 2022 .
- 2021 .
- 2020 .
- 2019 .
- 2018 .
- 2017 .
- 2016 .
- 2015 .
- 2014 .
- 2013 .
- 2012 .
- 2011 .
- 2010 .
- 2009 .
- 2008 .
- 2007 .
- Dec. 2007: What will next season be like?.
- Nov. 2007: The ocean is going up and down around the Solomon Islands.
- Oct. 2007: South Atlantic Anomaly as seen by Doris.
- Sep. 2007: Altimetry on eddies' tracks.
- Aug. 2007: Altimetric views of a typhoon.
- Jul. 2007: Cruising speed measurements.
- Jun. 2007: Water flowing under the ice.
- May 2007: Turns of the seasons in the Ocean.
- Apr. 2007: Discovering a current in the 21st century.
- Mar. 2007: Malaria and altimetry in the Amazon.
- Feb. 2007: Ierapetra gyre pops in and out.
- Jan. 2007: El Niño on time for Christmas.
- 2006 .
- 2005 .
- 2004 .
- 2003 .
- 2002 .
- 2001 .
- 2000 .
- 1999 .
- 1998 .
- Operational news and status .