


In-situ 2011 validation
The annual reports present the synthesis of the comparisons of two kinds of in-situ measurements with Sea Surface Height altimetry: tide gauges and ARGO T/S profiles.
Both studies allow to
1. Detect any potential drifts or jumps in the altimeter Mean Sea Level (MSL)
2. Estimate the potential improvements of the altimeter SSH provided by new altimeter standards
3. Detect the potential anomalies of the computed in-situ datasets
FOCUS ON TIDE GAUGE COMPARISONS:
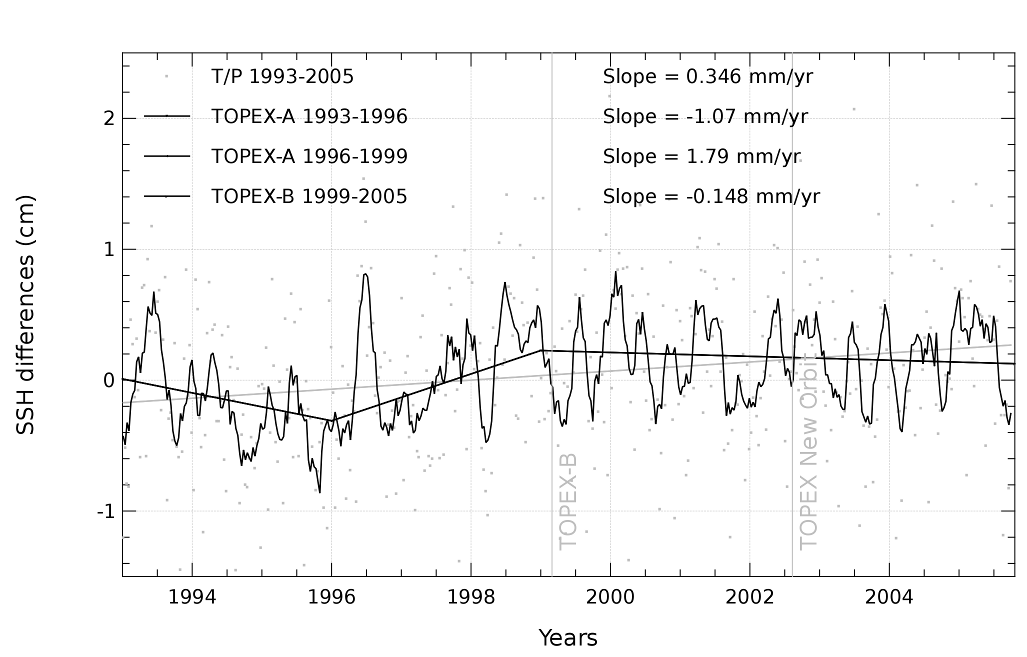
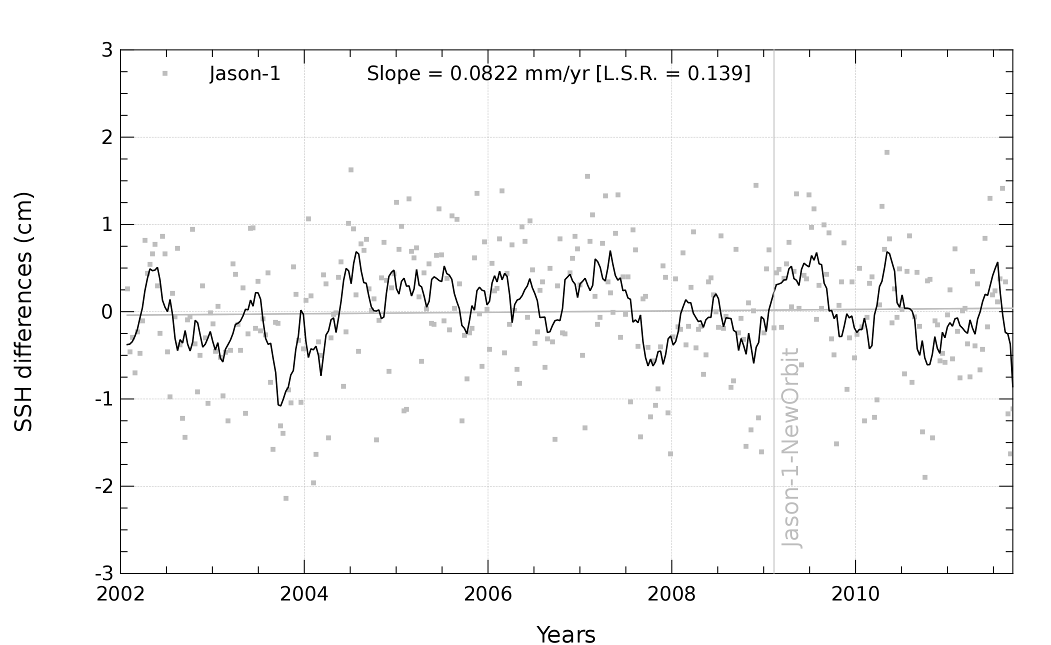
- Considering both TOPEX/Poseidon and Jason-1, the comparison with tide gauge measurements reveals consistent long-term trend differences of respectively 0.4 mm/yr and 0.1 mm/yr, with a low formal adjustment error (Figures A-1, left, middle). For almost 10 years of consistent altimeter data delivery, the coherence with in-situ measurements along coastal areas is generally good with a reliable assessment of both T/P and Jason-1 for the global network, in agreement with results obtained for a 64 near real-time tide gauge network (Leuliette et al., 2004 and Beckley et al., 2010).
- Leuliette, E. W., R. Nerem, and G. Mitchum. 2004. Calibration of TOPEX/Poseidon and Jason Altimeter Data to Construct a Continuous Record of Mean Sea Level Change. Marine Geodesy, Volume 27, Issue 1-2, Part 2, pp. 79-94.
- Beckley B., N. Zelensky, S. Holmes, F. Lemoine, R. Ray, G. Mitchum, S. Desai, and S. Brown. 2010. Assessment of the Jason-2 Extension to the TOPEX/Poseidon, Jason-1 Sea- Surface Height Time Series for Global Mean Sea Level Monitoring. Mar. Geod. 2010, 33 447-471.
-
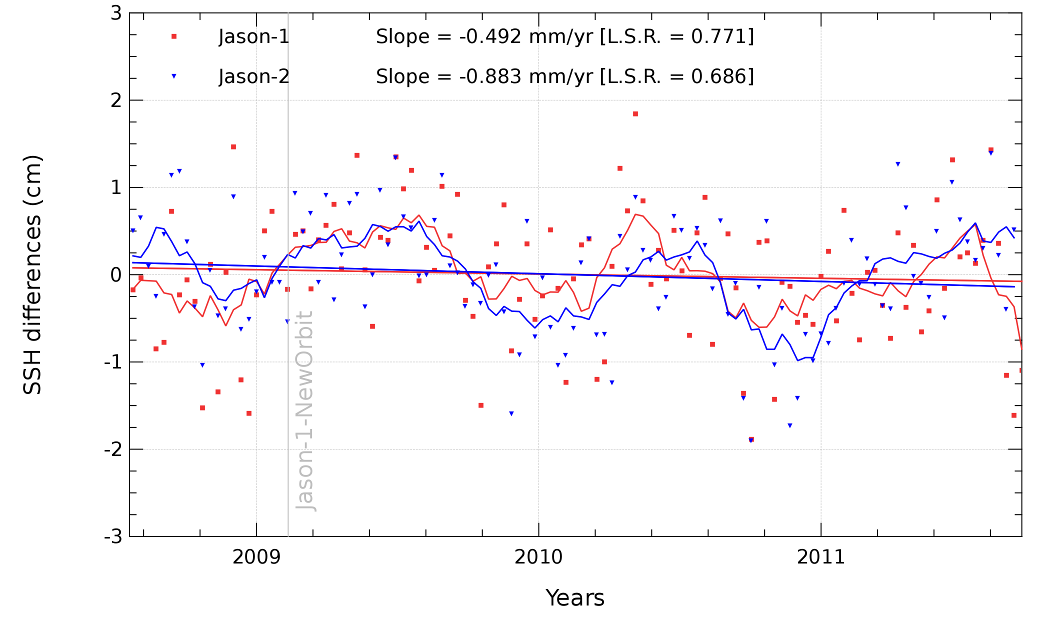
Furthermore, looking at the Jason-2/tide gauge residual signals superimposed with those for Jason-1 (Figure A-1, right), the 2 cm amplitude and periodic signals of the global data time series differences are in very good agreement for the same period, although trend differences are slightly different from Jason-1 data between 2008 and 2011 (-0.5 mm/yr for Jason-1 and -0.9 mm/yr for Jason-2, with a formal adjustment error of about 0.7 mm/yr).
 |  |  |
|---|---|---|
Figure A-1: Comparisons in cm between altimetry and tide gauges in terms of drifts for TOPEX/Poseidon (left), Jason-1 (middle) and | ||
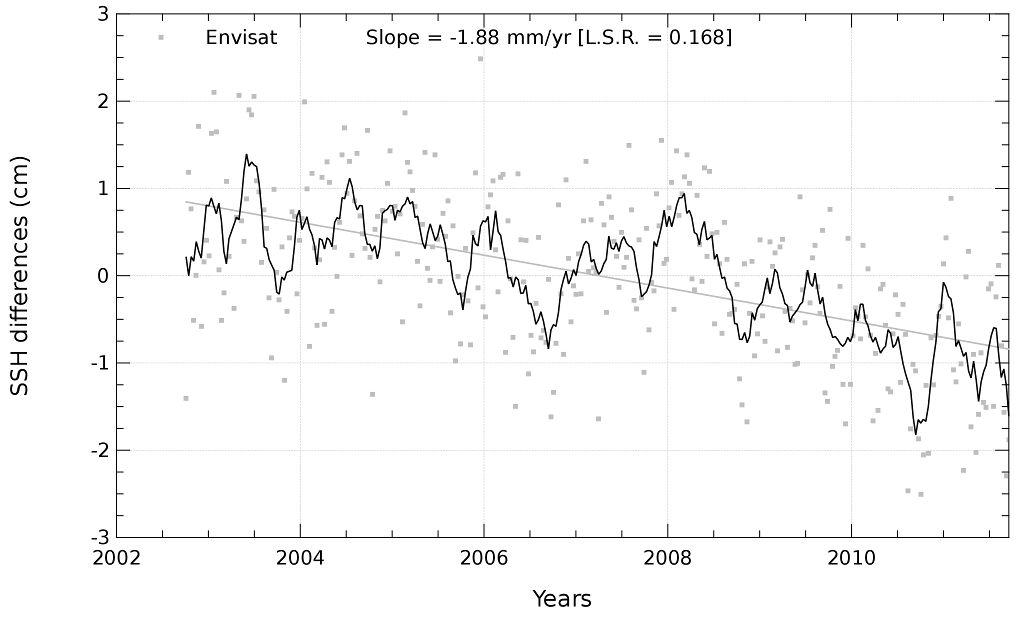
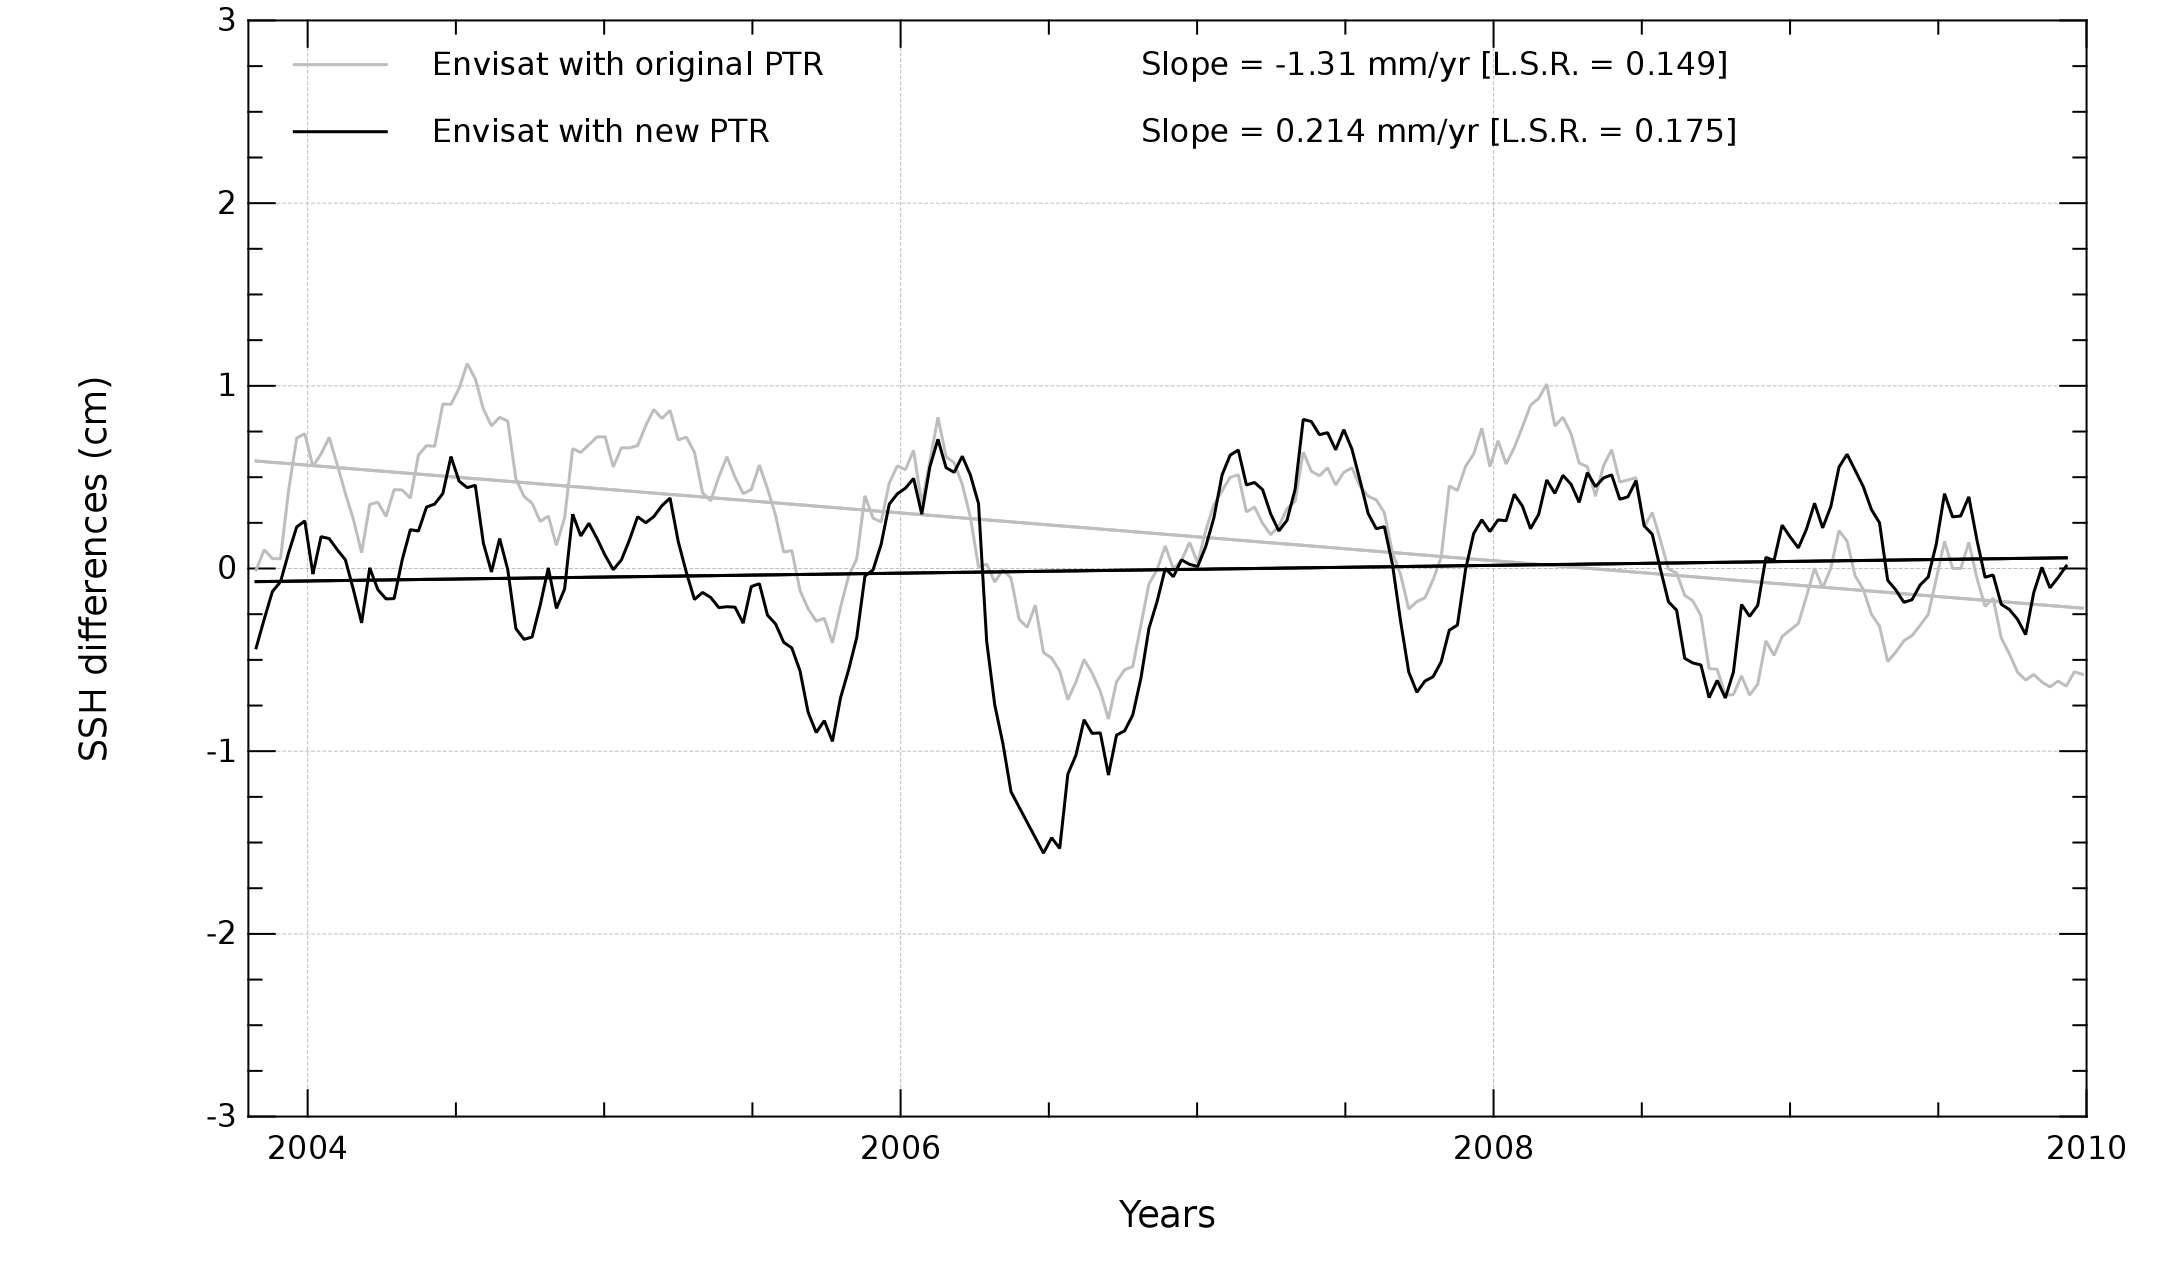
- Concerning differences between Envisat data and tide gauge measurements display a negative drift close to -1.9 mm/yr on the 2002-2011 time period. The formal adjustment error is slightly higher than for other missions (close to 0.2 mm/yr) and amplitudes of residual signals are greater than 3 cm, waiting for the reprocessing of altimeter data to be done (Figure A-2, left). As a way of evaluating new standards in altimeter products, tide gauge measurements have thus been used to demonstrate the relevance of a new PTR correction in the framework of the Sea Level Climate Change Initiative (SL-CCI) project supported by ESA (http://www.esa-sealevel-cci.org). The monitoring of Envisat data when adjusting the new PTR (Figure A-2 right) shows an improvement in the consistency with tide gauges compared to the previous PTR correction. The slope of the differences between altimetry and tide gauges reaches the same order of magnitude as Jason-1 results, with a global trend of 0.2 mm/yr, in agreement with the theory and the multi-mission cross-calibration studies.
 |  |
|---|---|
Figure A-2: Comparisons in cm between altimetry and tide gauges in terms of drifts for Envisat (left) and comparison between Envisat with original PTR and with new PTR (right). | |
- For each tide gauge, the quality control is performed and displayed as a cross-comparison indicator on the AVISO website (http://www.aviso.oceanobs.com/fr/calval/in-situ-global-statistics/index.html) and is used to select relevant tide gauges for altimeter/in-situ comparisons. Only tide gauges which are well correlated with all altimeter data (correlation > 0.7) are considered to be reliable and usable for detecting potential drifts or jumps in altimeter time series, or in the estimate of the quality of new altimeter standards.
To read complete syntesis: Annual validation report for comparisons between altimetry and tide gauges 2011
FOCUS ON ARGO T/S COMPARISONS:
-
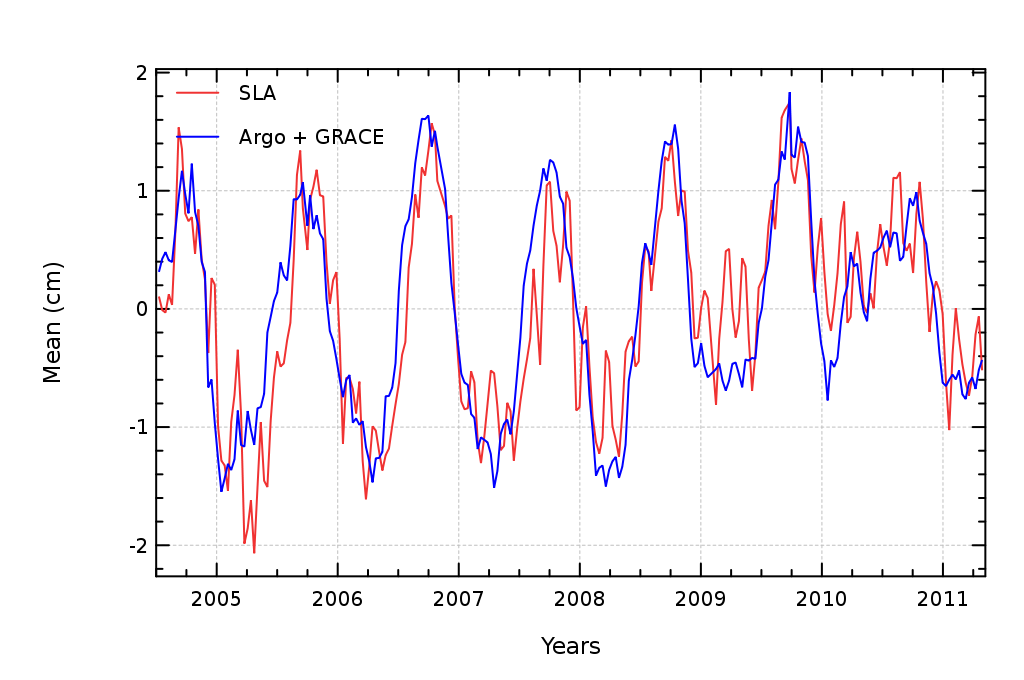
Analyses of the past years have demonstrated that anomalies in the altimeter measurements can be detected thanks to the comparison with Argo in-situ measurements by relative differences. Thanks to this method, the regional MSL trend differences observed between Jason-1 and Envisat has been mainly attributed to Envisat mission and it was associated to the orbit solution. This year, we have focused on the improvement of the accuracy on the absolute trend of sea level differences between altimeter and in-situ data by adding the mass contribution to the sea level (GRACE measurements) to the Argo steric contribution so that similar physical contents are compared (figure B-1).
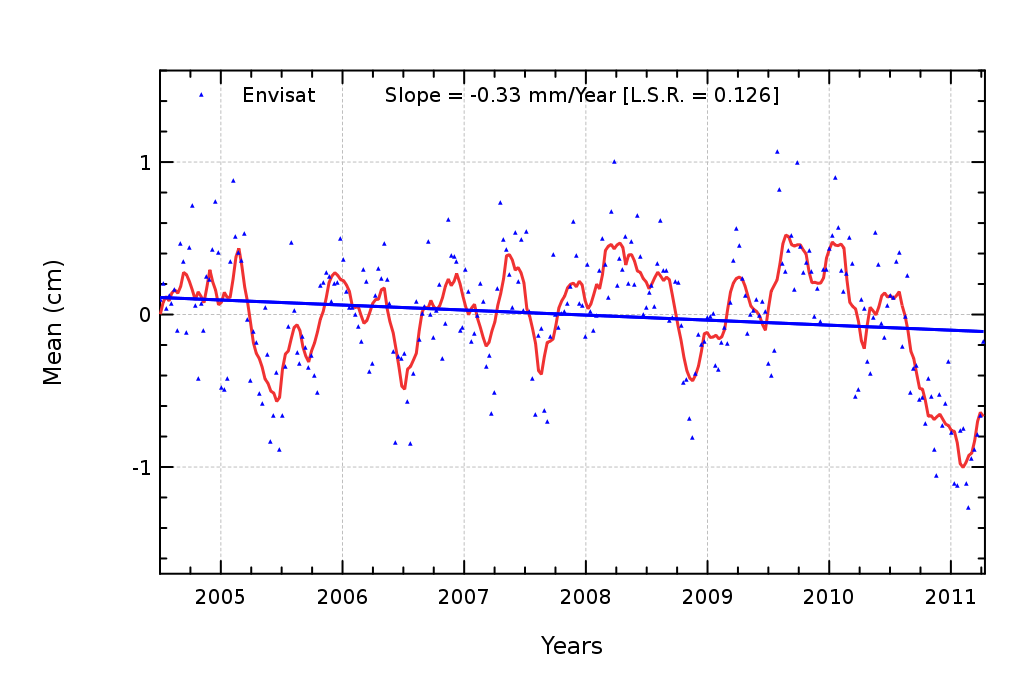
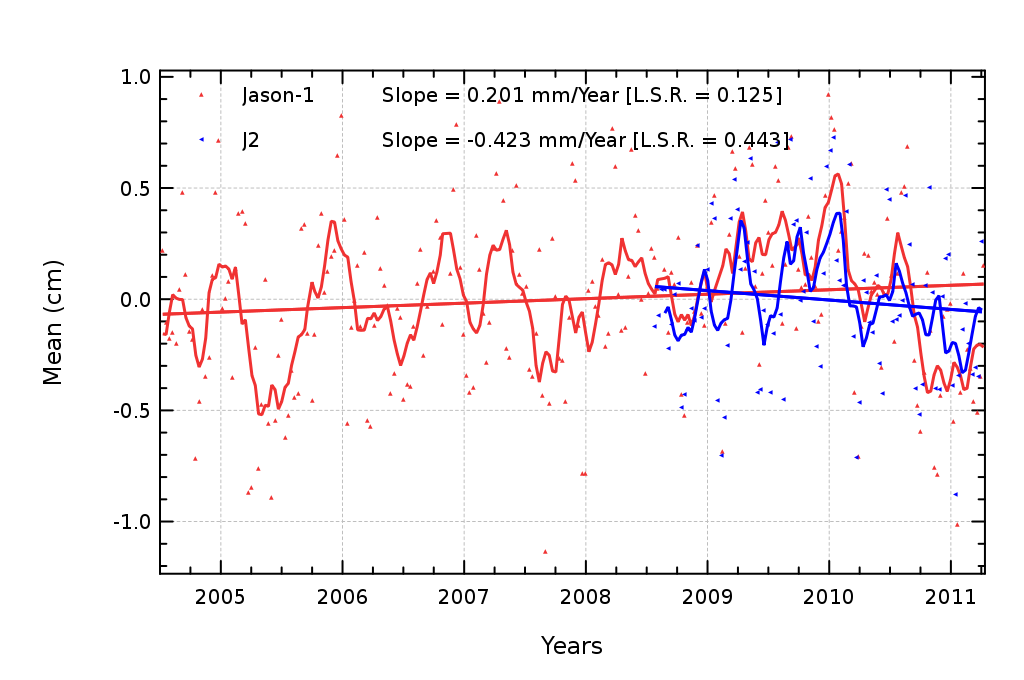
The trend of the altimeter residuals over the 2004-2011 period are -0.3 mm/yr for Envisat and 0.2 mm/yr for Jason-1 (figures B-2 and B-3).
 |  |  |
|---|---|---|
Figure B-1: Monitoring of Jason-1 SLA colocated | Figure B-2: Monitoring of the Envisat | Figure B-3: Monitoring of the Jason-1 and Jason-2 |
To read complete syntesis: Annual validation report for comparison between altimetry and ARGO T/S profiles 2011
Further information:
- Valladeau G, J.-F. Legeais, M. Ablain, S. Guinehut and N. Picot, 2012: "Comparing altimetry with tide gauges and Argo profiling floats for data quality assessment and Mean Sea Level studies. Vol.3 Marine Geodesy special issue on Jason-2". In press
- Systematic Validation activties
- Annual validation report for comparisons between altimetry and tide gauges 2011
- Annual validation report for comparison between altimetry and ARGO T/S profiles 2011
- Mean Sea Level Rise
- In-situ tide gauges global statistics