


Geodesy
Geodesy is the science of the Earth's shape and size. Altimetry contributes to this discipline by calculating the Mean Sea Surface, which includes the geoid, i.e. sea level in the absence of disturbing forces (tides, winds, currents, etc.), as well as the Mean Dynamic Topography, i.e., the sea surfaceheigt due to the stable currents. The geoid reflects the Earth's gravity field. Its undulations vary about +/- 100 m over distances of several thousand kilometers. They are generated by the heterogeneous distribution of mass within the Earth's crust, mantle and core. Other, smaller height irregularities are also visible over shorter distances. These reflect underwater topography.
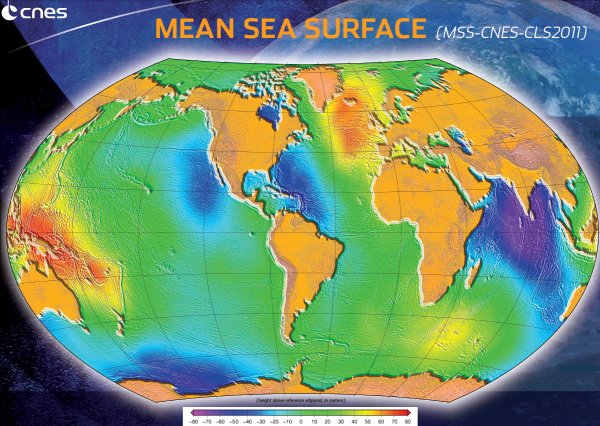
Mean Sea Surface, representing the sea level resulting from constant phenomena, computed from 16 years of altimetry data acquired by Topex-Poseidon, ERS1&2, Envisat, GFO and Jason-1 satellites. This Mean Sea Surface is shaped by permanent ocean currents and, above all, by the gravity field. Differences below the surface of the Earth (for example, variations in magma temperature) can generate sea level variations of over 100 metres between two ocean regions thousands of kilometres apart. At smaller scales (a few kilometres), we can also observe on this surface (highlighted here so as to be visible) the influence of ocean floor topography (see bathymetry) which causes variations of several metres at the ocean surface. (Credits CNES/CLS 2012). Further information
The geoid is defined as an equipotential surface of the Earth's gravity field. Basically this means that if we could place balls all over the surface of the ocean, none of the balls would roll down the hills of this surface because they would all be on the same "level" (i.e. at the same gravity) and subsequently, that the waters of the currents would not flow due to geoid height variations. This equipotential surface deviates by about +/- 100 metres from the reference ellipsoid, the ideal mathematical shape which fits the rotating Earth most closely.
On the oceans, the geoid coincides with an ocean surface at rest (i.e. with no external forces applied, neither wind nor tides, and with no effect from the Earth's rotation). Thus, a bump on the geoid, for example a undersea relief corresponds to an excess of mass, while an oceanic trough, which can be associated with a deficit of mass, will create a depression. Those excess or deficit can match undersea reliefs, but also be linked to variations within the Earth's mantle. By measuring very precisely ocean undulations, the altimetry satellites make it possible to map the geoid.
The mounds and trenches on the seafloor cause very slight variations in the Earth's gravity field. For example, a 1000-m-tall undersea mountain can cause a bump of about 10 cm high with a radius of about 10-20 km (roughly: it depends on different parameters, such as the density of the mountain). This bump cannot be seen with the naked eye because it is very shallow. In practice, altimetry data, collected by different satellites over many years, are combined to achieve high data density and to average out sea surface disturbing factors such as waves, winds, tides, and ocean variability. The only other component of mean sea surface that is not the geoid is then the static currents (mean dynamic topography), which have to be explained using different methods and then subtracted (see Altimetry Basic Principles Large-scale ocean circulation).

Long wavelengths geoid undulations
The greatest geoid heights and those most visible on a map, reflect deeply-buried density variations.
To see an animated 3D geoid, click on 3D interface.
Gravity anomalies
In order to enhance small-scale features, the high-precision geoid can be converted into gravity anomalies. Gravity anomaly computations are quite complex, based on laws of physics, geometry and statistics (e. g. see [Sandwell and Smith, 1997]).
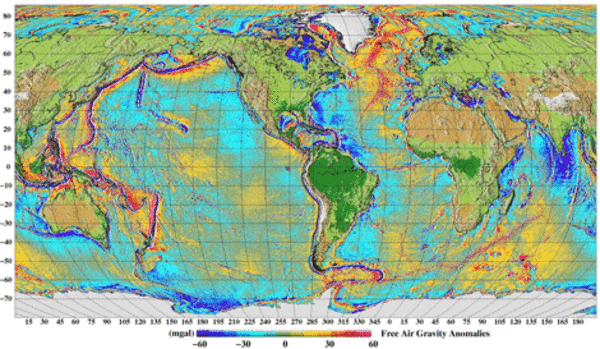
Gravity anomalies from the DNSC05 geoid model. (Credits Danish National Space Center).
References:
- Green, C. M., Fairhead, J. D., and Maus, S., Satellite-derived gravity: Where we are and what's next: The Leading Edge, 17, 77-79, 1998.
- Haxby, W. F., Karner, G. D., LaBrecque, J. L., and Weissel, J. K., Digital images of combined oceanic and continental data sets and their use in tectonic studies: EOS, 64, 995-1004, 1983.
- Li, Xiong, and Hans-Jürgen Götzez, Tutorial: Ellipsoid, geoid, gravity, geodesy, and geophysics, Geophysics, vol. 66, no. 6 (november-december 2001); p. 1660-1668, 2001.
- Sandwell,D.T., and Smith,W.H.F., Marine gravity anomaly from Geosat and ERS-1 satellites: J. Geophys. Res., 102, 10039-10054, 1997.
- Yale, M. M., Sandwell, D. T., and Herring, A. T., What are the limitations of satellite altimetry ? The Leading Edge, 17, 73-76, 1998.
Further information:
- Bumps and depressions of the geoid on Google Earth (Download the kml file and open it in Google Earth).
- G. Louis et al., OST/ST 2008 meeting, Modeling the oceanic gravity field by a high resolution altimetric satellite mission, pdf.
- Tapley, B.D. and M.C. Kim, Applications to geodesy, Satellite altimetry and Earth sciences, L.L. Fu and A. Cazenave Ed., Academic Press, 2001.
- Interactive 3D interface to see a multi-faceted globe.
- Images of the month related to geodesy :
- Ocean ridges, December 2002,
- Doris measures plate motion, July 2002,
- Ocean circulation with gravity, May 2004.
- Newsletters related to geodesy :
- #6 : An oceanographic estimate of the geoid height in the North Atlantic (P. Le Grand, 1998),
- #6 : Application of Precise Altimetry to the Study of the Earth's Gravity Field in the Western Pacific Region and the Dynamics of the Earth (Y. Fukuda, 1998),
- #6 : Topex/Poseidon, Gravity, and the Earth's Rotation: Investigating Mechanisms and Effects of Sea Level Change (R. S. Gross, 1998),
- #6 : Monitoring geoidal potential on the basis of TOPEX/POSEIDON altimeter data (M. Bursa, 1998),
- #8 : Ocean Circulation, Height Systems and Gravity Field Studies based on Jason-1 Altimetry (E.J.O. Schrama, 2001),
- #8 : Gravity, Bathymetry, and Mesoscale Ocean Circulation from Altimetry (S.T. Gille,2001).