


Venice Acqua Alta
In the City of the Doges, the phenomenon named "Acqua alta" is described as any temporary flooding of the lagoon and some streets of the city by the Adriatic Sea water. The average altitude of the city built on a marshy area is only a few decimeters; making it quickly vulnerable to rising water levels and more frequent floods.
This phenomenon is the consequence of several climatic, meteorologic and entropic factors:
- the overall rise in sea level,
- a strong moon tide,
- the winds, such as the Sirocco and the Bora, which blow on the Adriatic, tend to accumulate water in the Gulf of Venice,
- atmospheric depressions that tend to increase the water level. These meteorological phenomena of depressions and winds can also be at the origin of the formation of natural oscillation modes of the local ocean basin - seiches - which can even come into resonance with the tidal wave.
- an unusual meteorological phenomenon, producing heavy rainfall on the land north of the region,
- the intervention of the man who has weakened the natural protection of the lagoon,
- finally, the sinking of the City, attributable to the pumping of groundwater and ground's compaction from buldings.
Venice Acqua Alta November 2019’ event measured by satellite altimetry
The strong sea level elevations that occurred in Venice during November 2019 have been measured by the satellite altimetry constellation. The data from 5 altimeter satellites are currently processed and calibrated in real time by the CMEMS/SLTAC production center to produce a set of homogeneous along track and gridded multi-mission products. On November 13th, 3 satellites (Copernicus Sentinel3A & B and Jason-3) crossed the Adriatic Sea, measuring the sea level at several times and locations (Figure 1).
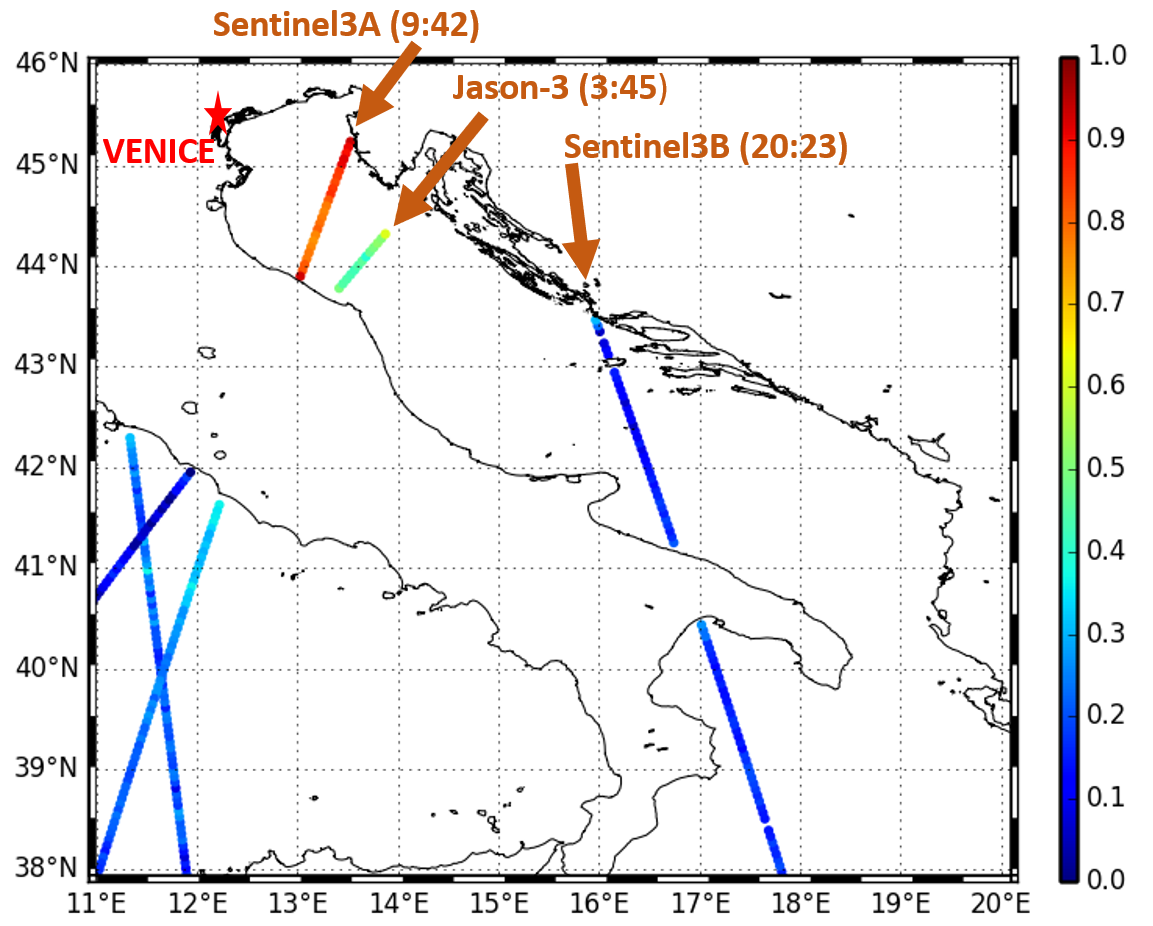
Sentinel3A flew very close to Venice at ~10 GMT, only ~1 hour after the maximum surge (see Figure 2), and measured an elevation reaching 90cm (Figure 3). Jason-3 flew slightly East of Sentinel3A earlier the same day, 5h before the maximum surge, and measured a Sea Level of 51cm strongly lower than Sentinel3A. This difference is well explained by the quick evolution of the surge between the two passes. Finally, Sentinel3B was flying on the Eastern part of the Adriatic (off Vieste city) later the same day when the atmospheric depression got weaker and measured an elevation of 14cm.
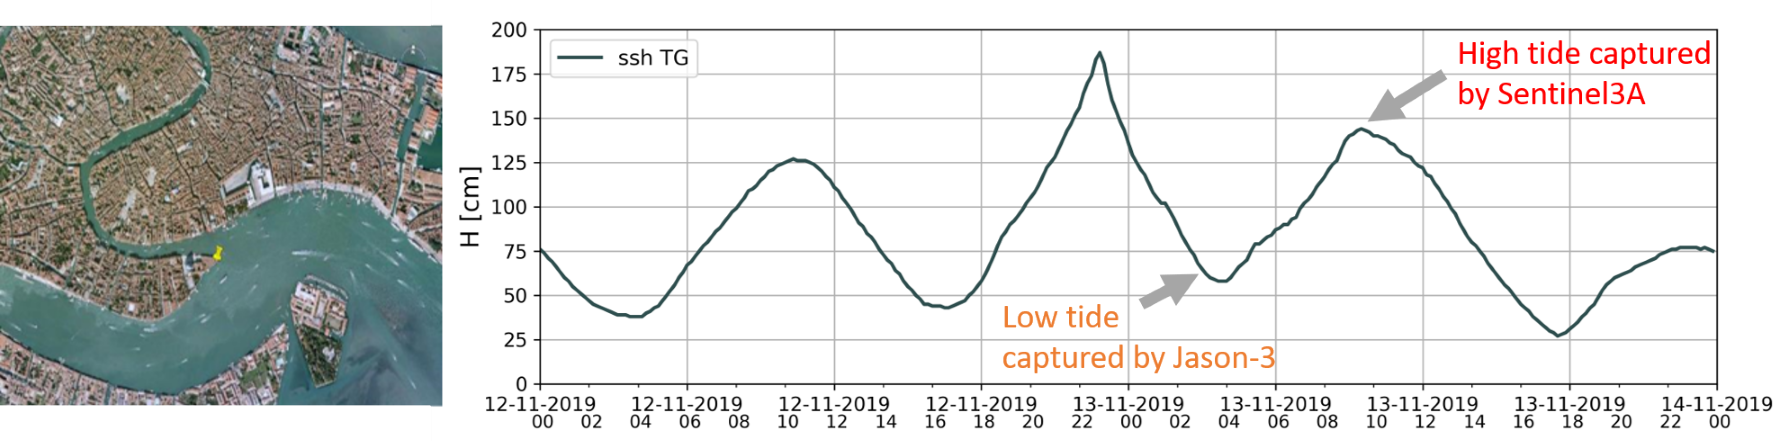
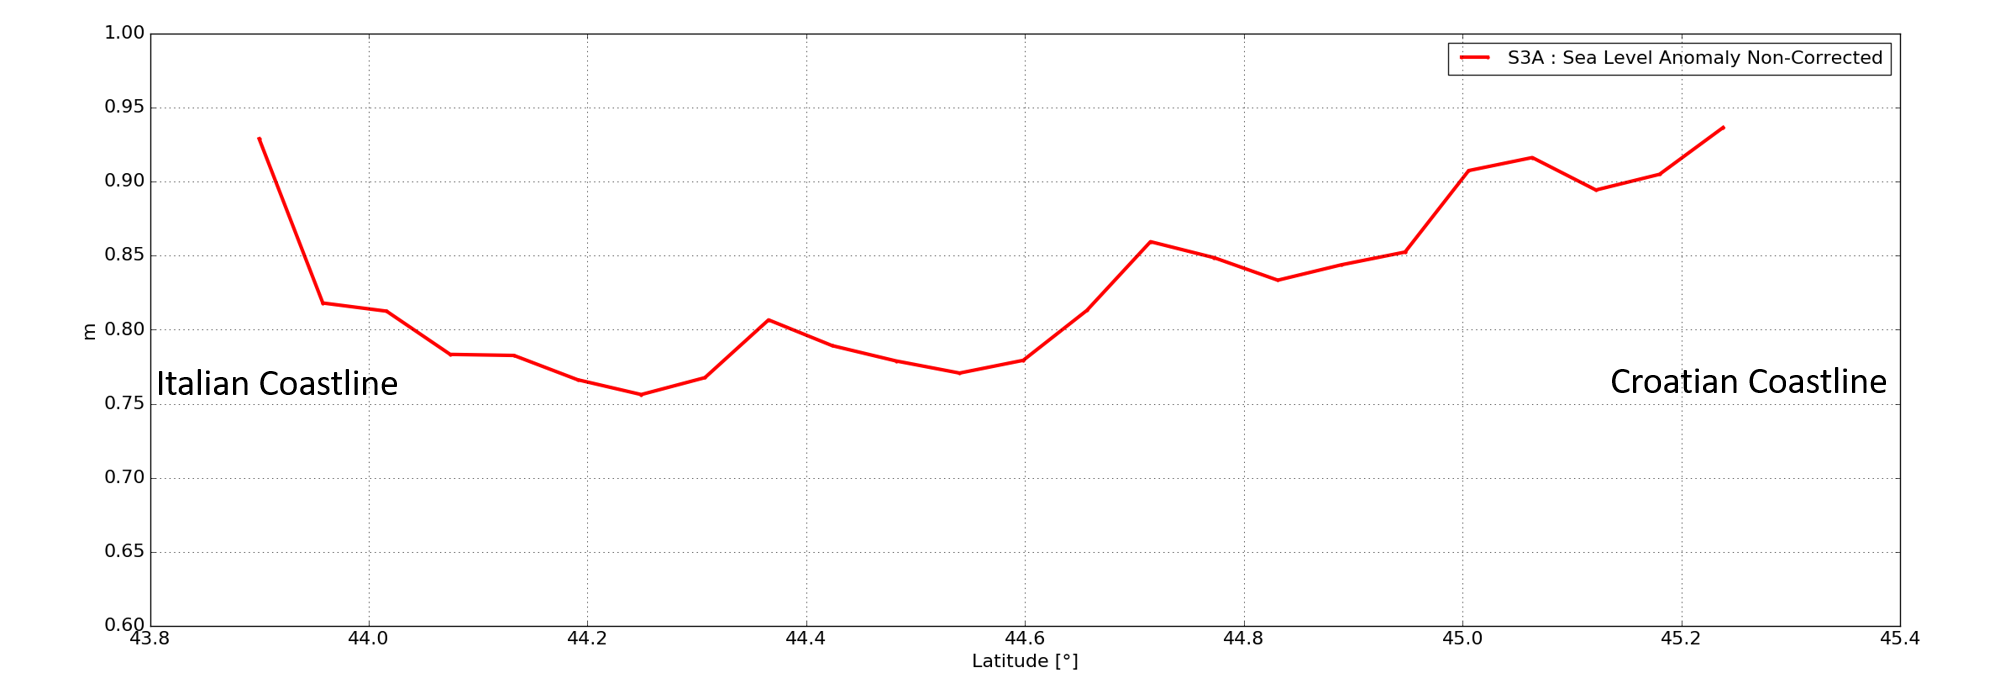
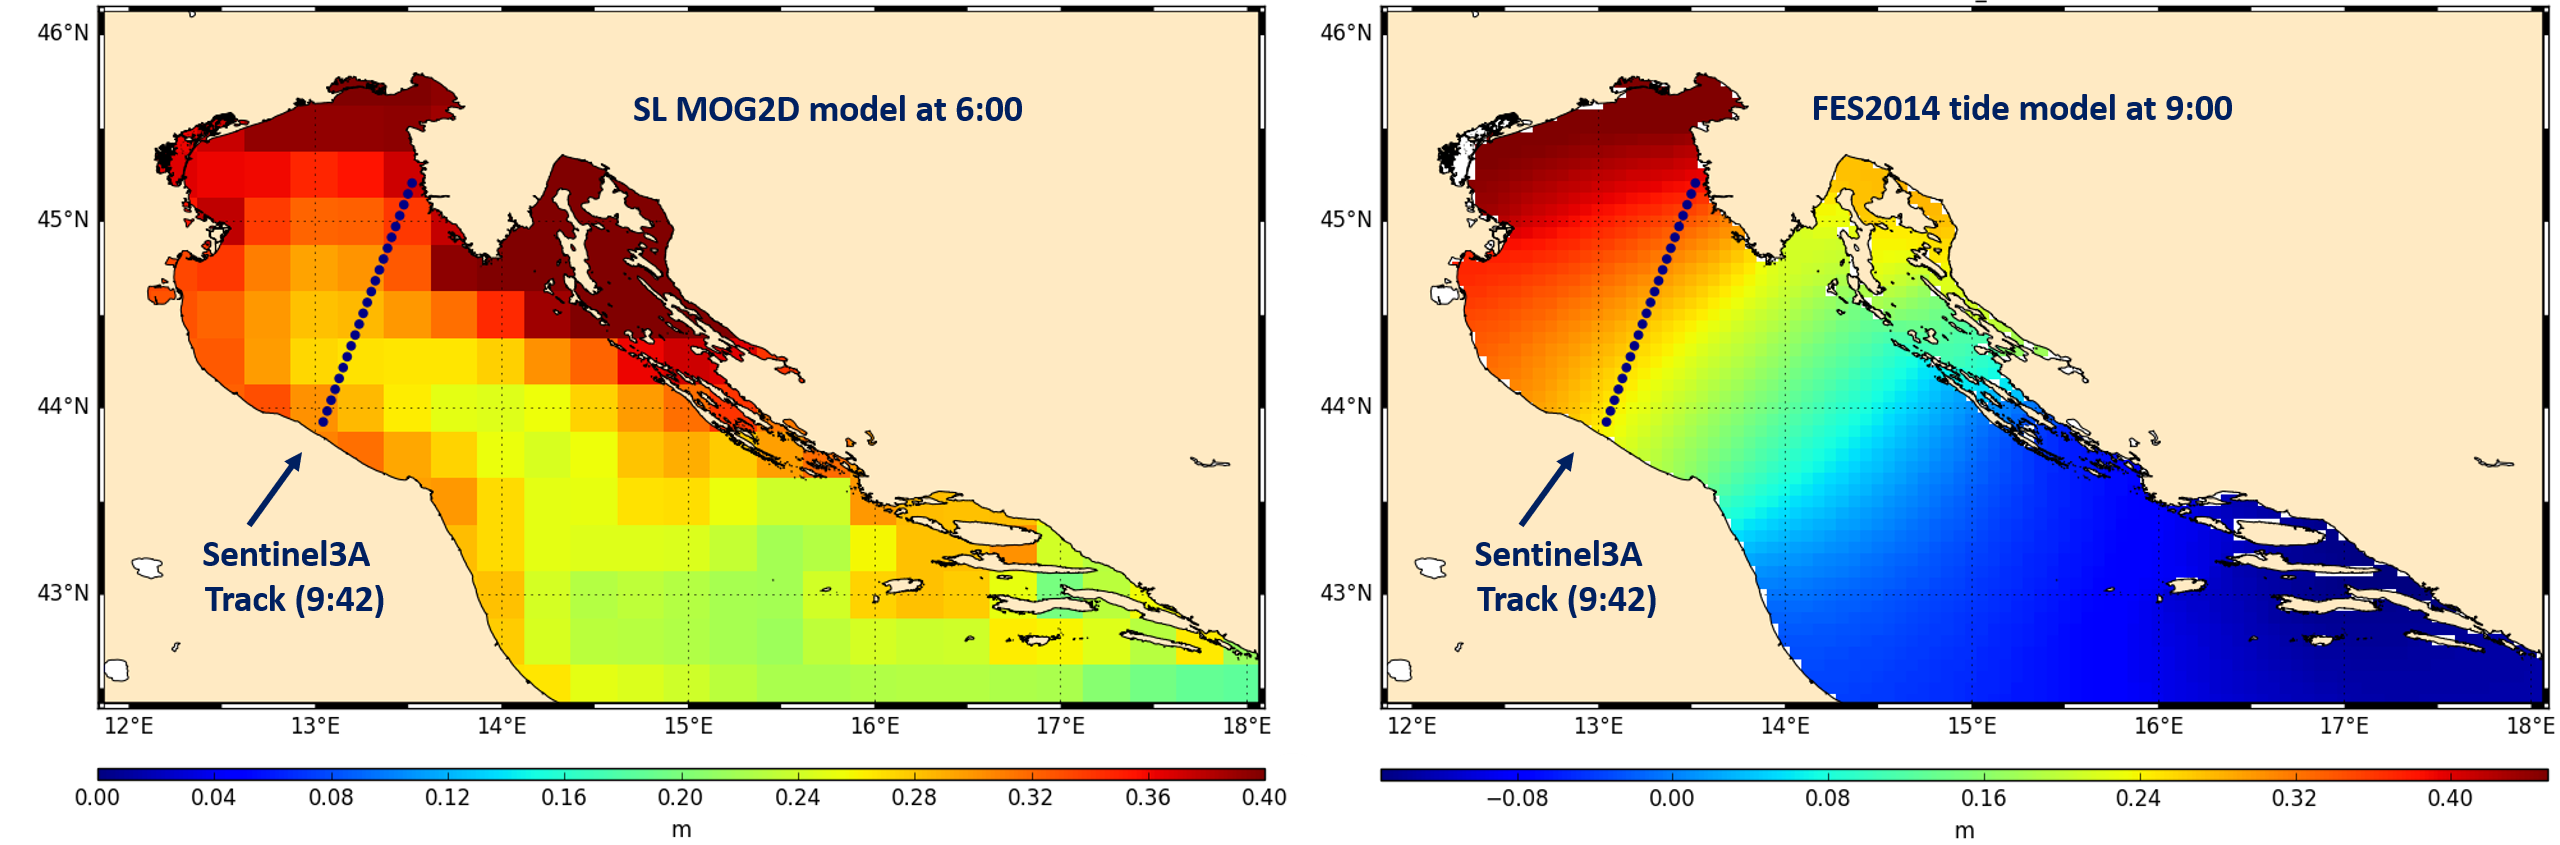
The modeling of surge with MOG2D operational model (Figure 4 left) at 6:00 on Dec 13th shows an amplification of the sea level elevation near the coasts which also seen with altimeter measurements (Figure 3). The FES2014 tidal model prediction (Figure 4 right) shows a maximum tidal amplitude at 9:00 on Dec 13th, which is close to the Tide Gauge measurements (seen on Figure 2).
The city of Venice has suffered assaults from the sea for many years.
A video showing altimetry applications was made for Jason-2, see the full article here