


Hurricane Irma seen by remote sensing satellites
The cyclone Irma has left a path of destruction from the north of the Lesser Antilles to Florida all along its path between the 6th and 10th of September 2017.
This cyclone, classed as category 5 on the Saffir-Simpson scale, was shockingly wide for such its persistence, its power with winds exceeding 300 km/h, its waves height reaching almost 8 m. The combined effect of waves and wind also generated strom surge, flooding several islands.
The images as photos from meteorological satellites highlighted the exceptional dimensions of this cyclone. However, if we are now used to seeing these kind of images, they do not do everything. To further analyze and measure the cyclone intensity, sensors onboard meteorological satellites and onboard ocean observation satellites enable to measure a wealth of physical measurements which can be assimilate in forecasting models with temperature, rain, wind and wave variables.
The coupled ocean-atmosphere models allow for combining several sources of measurements and to take into account the influence of the ocean, and more particularly its temperature, on the genesis, intensity and path of the cyclone. Indeed, cyclones get their energy from the ocean heat, as a fire needs oxygen to burn. The energy content of the ocean, ie the amount of heat contained in a layer of water more than 26°C, enables to quantify the energy available to fuel the cyclone.
Several examples given below illustrate measurements of wind speed, wave heights or energy content from Sentinel-1, Sentinel-3 (ESA), Jason-3 (CNES/NASA/EUMETSAT/NOAA) satellites, or from the MOG-2D (CNES/SALP) and PSY4-QV3 (Mercator Ocean/CMEMS) models.
In 2018, the CFOSAT (CNES/CNSA) satellite will be launched to measure wind and waves on the surface of the oceans. These data will enable more reliable predictions of the sea state and a better understanding of the interactions between the ocean and the atmosphere during such extreme events.
Wind speed measurement with Sentinel-1
The Copernicus/ESA Sentinel-1 mission with its Synthetic Aperture Radar (SAR) crossed the Irma’s path. An example is given below, when the cyclone approaches the Dominican Republic, September 07, 2017, 10:30 UTC. With the Interferometric Wide swath mode, the SAR shows images with alternating dark and light areas. The dark ones highlight areas of low backscattering values (low values in decibels) and are evidence of "quiet" areas, such as the eye of the cyclone. On the contrary, light areas with high backscattering values show rough surfaces (waves or rain).
An experimental processing of these measurements combining both the vertical and horizontal polarizations (VV and VH) of the SAR instrument allows for deducing the wind speed (right).
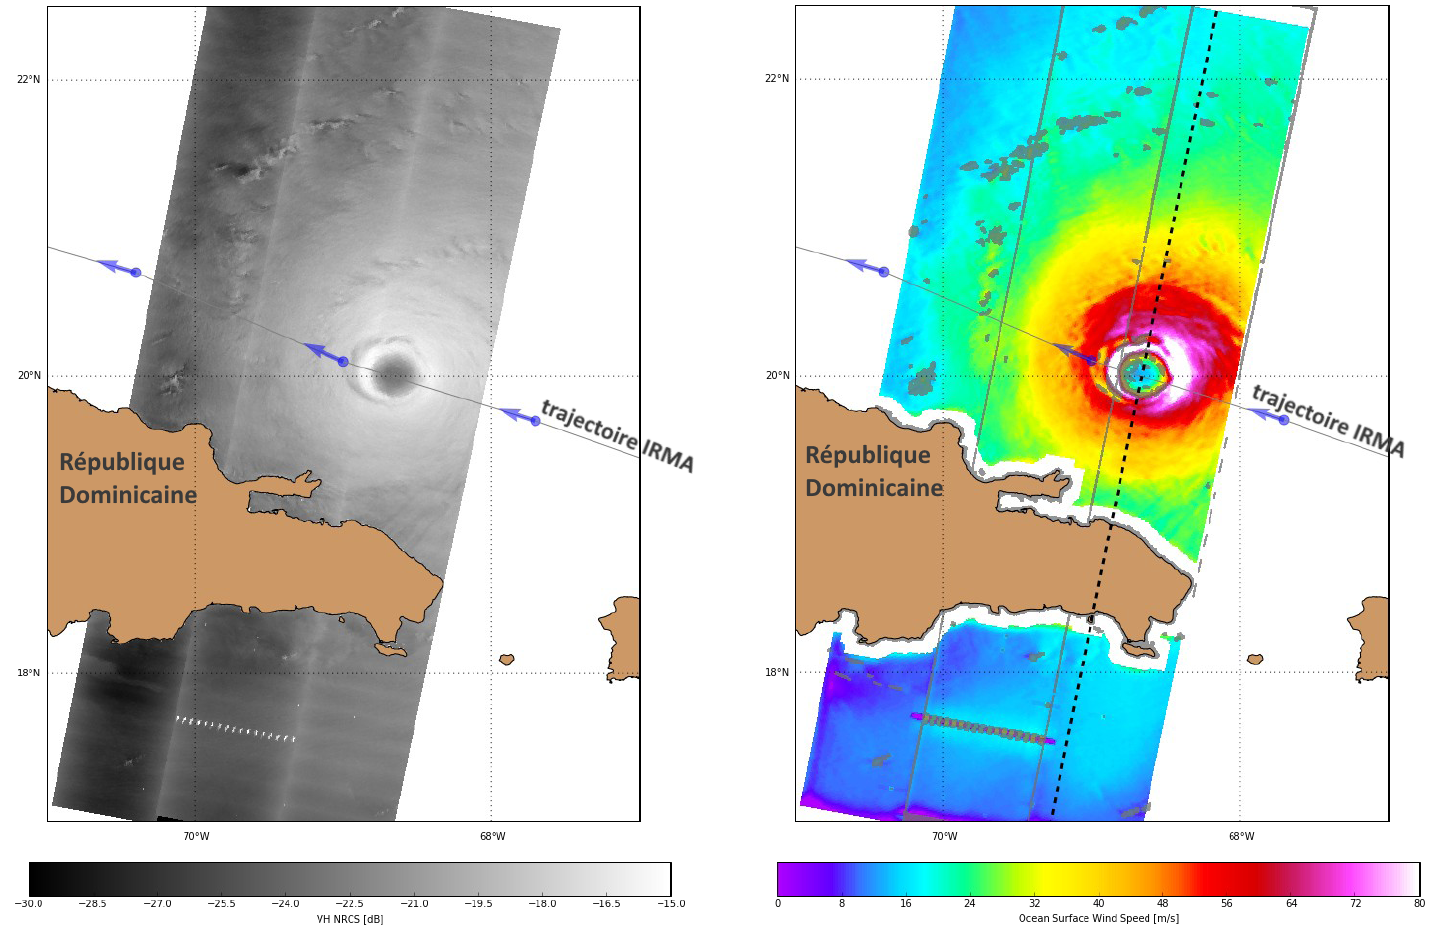
left: Image (polarisation VH) from the SAR instrument on the satellite Sentinel-1. Credits ESA, data from Copernicus/ESA.
right: Wind speed (m/s) deduced from the previous SAR image by combining both polarizations VH+VV, and by applying a normalized radar cross section inversion (NRCS). Credits IFREMER/CLS/NORUT/ODL/ESA, processing withinESA/SEOM project .
Storm surge and wave measurements
Jason-3 and Sentinel-3, both altimetric satellites, also crossed the Irma's path. An example is given on 2017/09/06 in the northern Caribbean arc. The MOG-2D model gives the sea level response to pressure and wind forcing.
A hurricane is a low pressure system which produce a higher sea level. The strong winds tend also to increase this phenomena by pushing waters. The cyclone literally sucks the ocean throughout its path. This is underlined by the red peaks on the maps below.
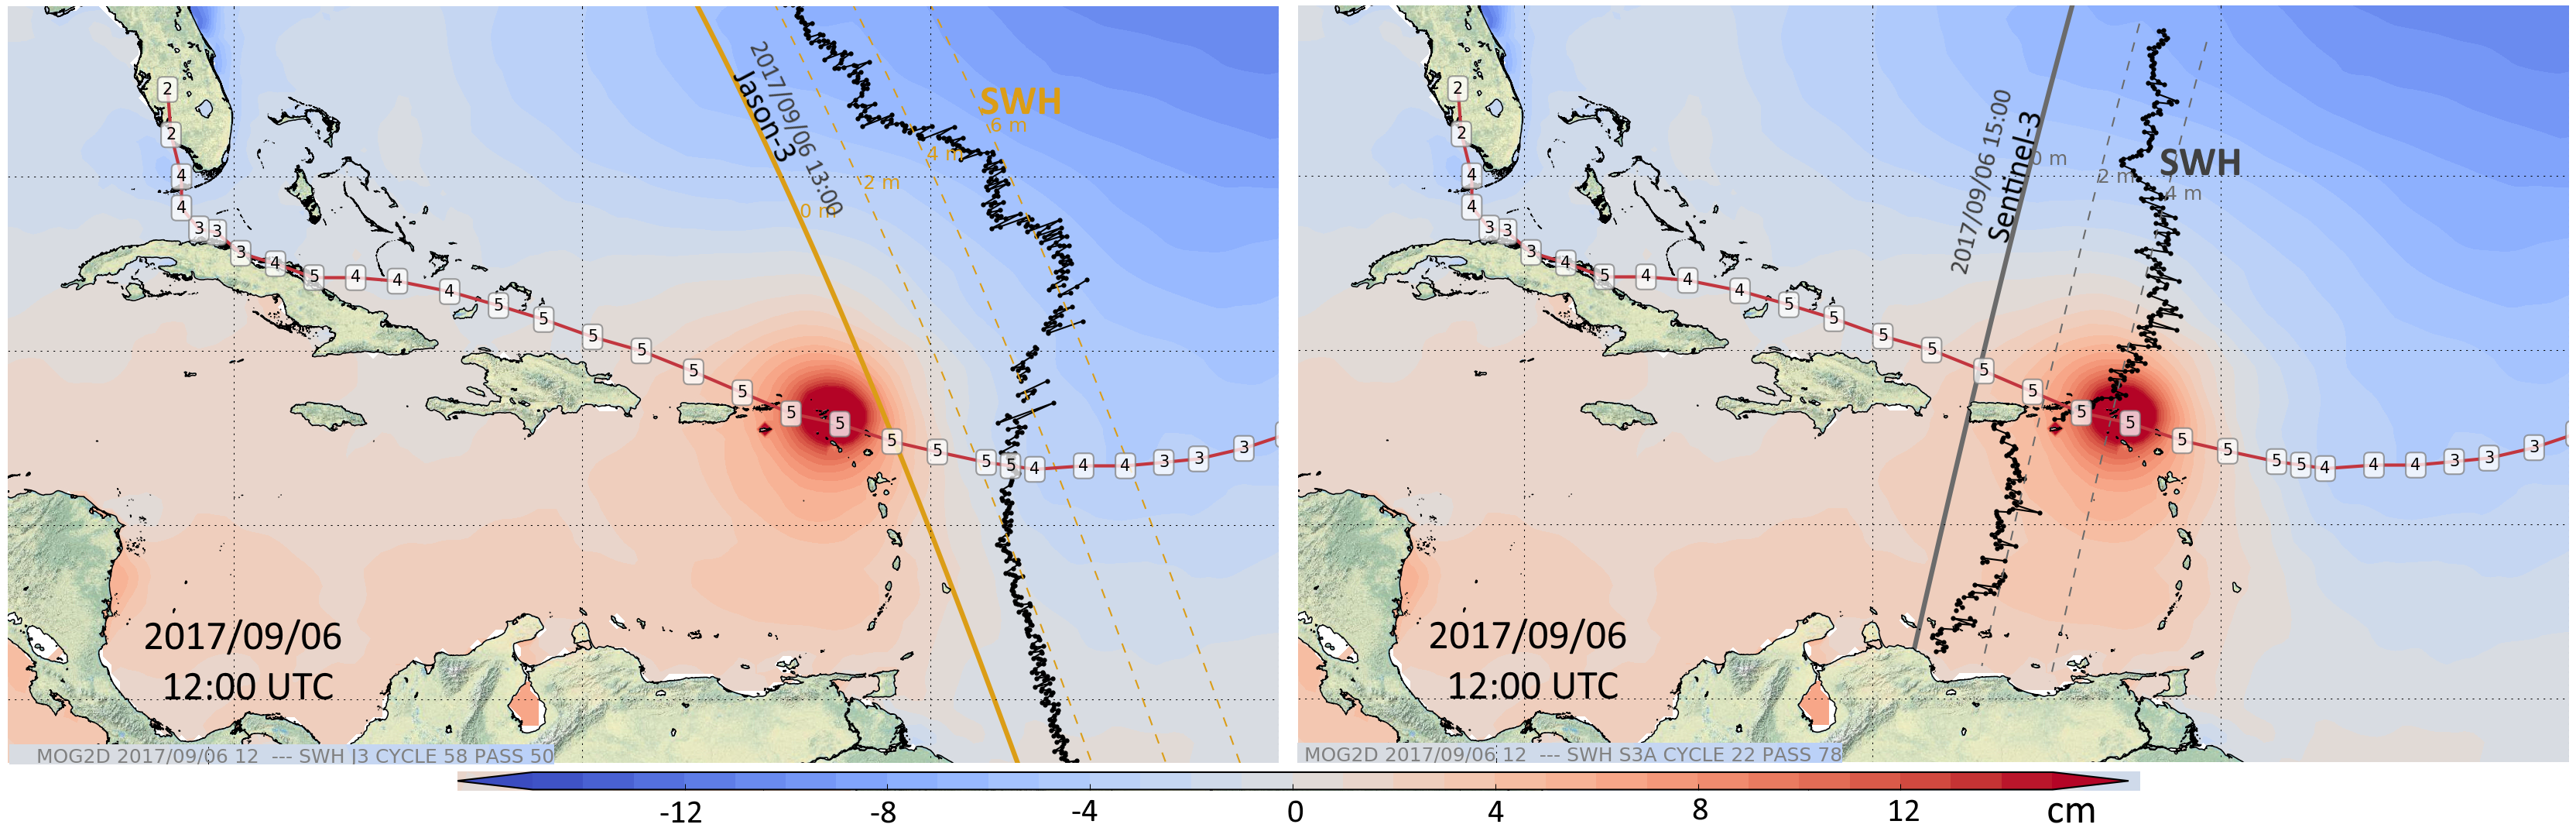
Sea surface heights due to pressure and wind forcing (in cm, colors in background) superimposed on significant wave heights (in m, black curve along the satellite ground track on 06 September 2017 during the hurricane Irma was crossing the area (red path, the squares indicate the category of the cyclone corresponding to the Saffir-Simpson scale). Sea surface heights are computed from the MOG-2D model on 2017/09/06, 12:00 UTC. Significant wave heights are computed from Jason-3 at 13:00 (left, cycle 058, pass 050) and Sentinel-3 at 15:00 (right, cycle 022, pass 078). Credits CNES/SALP - CNRS/LEGOS - CLS for MOG2D and wave from European Copernicus Marine Service (CMEMS-Sea Level Thematic assembly center). Another maps for another dates are given in this zipped file.
Animation with the sea level from the MOG2D model between 2017/09/01 and 2017/09/10, along Irma's path (western orange bump) and Jose (eastern orange bump).
Along-track measurements of Significant Wave Heights (SWH) from Jason-3 and Sentinel-3 satellite superimposed to InfraRed images (in blach and white) from GOES satellite.
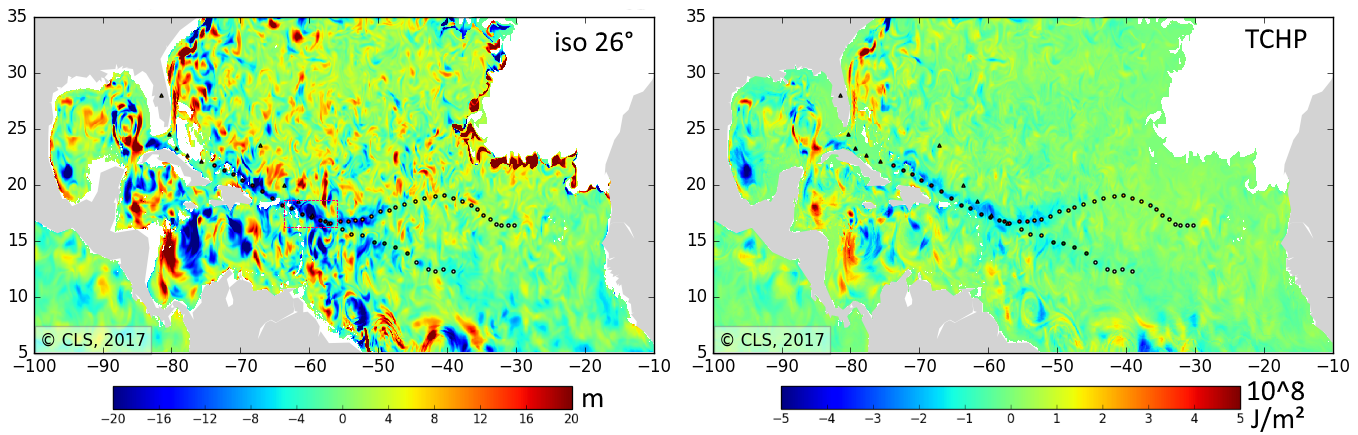
Ocean energy content
The depth of the isotherm 26°C between 03 and 08 September 2017 is lower (blue areas on the left map): the isotherm 26°C is 20 meters shallower on 08 September than five days earlier, on 03 September. In other words, after the cyclone has passed, the water has cooled, the water column whose waters are above 26°C has thinned after the cyclone.
The energy content of the ocean (Tropical Cyclone Heat Potential, TCHP, map on the right) is a computation that integrates the energy contained within the whole water column for temperatures above 26°C, which represents the energy available to fuel the cyclone. The blue areas, showing a lower energy content after the cyclone, coincides particularly well with Irma's path.
Further information:
- Data access:
- wind speed from Sentinel-1, ESA website.
- Sea level and wave heights with Jason-3 and Sentinel-3, Copernicus Marine Service website, Sea Level Thematic assembly center, SLA et SWH
- PSY4-QV3R1 model, 1/12°, dataset-mercator-psy4v3-gl12-bestestimate-sshst
to compute the ocean energy content, Copernicus Marine Service website, MFC-GLO
- Video Observing hurricanes and waves:
- Scientific references:
- Extreme winds with Sentinel-1 : A. A. Mouche and B. Chapron and B. Zhang and R. Husson, Combined Co- and Cross-Polarized SAR Measurements Under Extreme Wind, in IEEE Transactions on Geoscience and Remote Sensing, Vol. PP, Issue 99, pp1-10, 10.1109/TGRS.2017.2732508, 2017
- Altimetry data: Carrère et al., 2009: "Observing and Studying Extreme Low Pressure Events with Altimetry"