


What are mesoscale processes ?
A brief description of mesoscale processes observed by altimetry.
The ocean, like the atmosphere, is a fundamentally turbulent system. When we observe animations of the ocean’s sea level changes, what is most striking is that all of the world’s oceans are full of small-scale eddies and meanders, and at all latitude bands. The circulation is indeed dominated by mesoscale variability, due to ocean eddies or isolated vortices, meandering currents or fronts, squirts and filaments. The mesoscale variability generally refers to ocean signals with space scales of 50-500 km and time scales of 10-100 days.
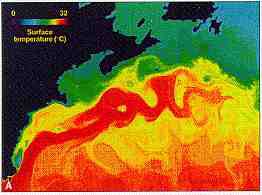
In the ocean, the energy of these mesoscale processes generally exceeds that of the mean flow by an order of magnitude or more. Most of the eddy energy is generated by instabilities of the mean flow, but fluctuating winds can also provide a direct forcing mechanism, which is particularly evident in low-eddy energy regions. Eddies can feed energy and momentum back into the mean flow and help drive the deep ocean circulation. They also transport heat, salt, carbon, and nutrients as they propagate in the ocean, and play a significant role in the global budgets of these tracers. Eddies are the principal mechanism for the transport of heat across strong currents, such as the Gulf Stream, the Kuroshio Current, or the Antarctic Circumpolar Current. Mesoscale processes also have a strong impact on the ecosystem, and on most operational oceanography applications (e.g., marine safety, pollution monitoring, offshore industry, fisheries, etc).
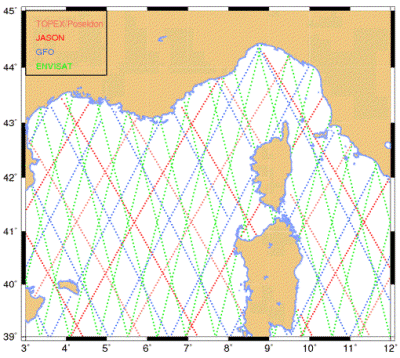
Over the last two decades, satellite altimetry has provided a global, high-resolution, regular monitoring of sea level and ocean circulation variations. The early satellite altimetry missions such as SEASAT (1978) and GEOSAT (1986-1989) provided our first global coverage of the ocean mesoscale sea level variations. Geosat data were extensively used for studying the ocean mesoscale dynamics. For the first time the eddy space and time scales were characterised and their regional variations investigated with respect to turbulence theory. What has changed since 1992, is the presence of at least two altimeter missions in orbit at the same time (and up to 5 in 2002!) providing precise measurements and the complementary sampling that is needed for ocean mesoscale variability monitoring. This multi-mission period has been underpinned by the very precise TOPEX/ POSEIDON (T/P) mission which was launched in 1992 on a 10-day repeat, and followed by Jason-1, launched in 2001. At the same time, ERS-1 (1991-1995), ERS-2 (1995-2005) and ENVISAT (2002 ->) were in orbit providing better spatial coverage on a 35-day repeat. GFO launched in 2000 on a 17-day repeat provided additional complementary altimetric coverage (see Fig. 1) The minimum requirement for a good representation of the ocean mesoscale variability is that at least two altimeter missions are in orbit, including one very precise long-term altimeter system. For near-real time operational studies 3 or 4 altimeters are required.
Applications
 Ocean .
- Coastal ocean applications .
- Ice and Cryosphere .
- Climate .
- Atmosphere, wind and waves .
- Geodesy and geophysics .
- Biology .
- Navigation by area .