


Typhoon Nargis
Lively Data: June 30, 2008
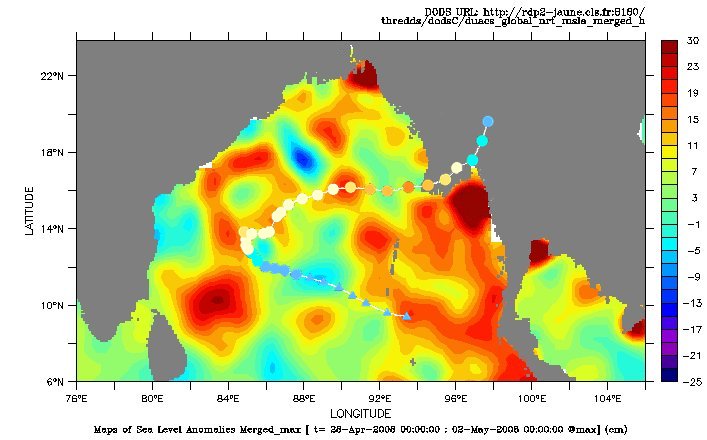
Maxima of the sea level anomalies computed from merged altimetry data over the period between the 28th of April and the 2nd of May. The hurricane's path was superimposed on it with its classification on the Saffir-Simpson scale (this last scale is showed below the map, overlay each category to know its limits). In the LAS, choose NRT - Global - (Maps of) Sea Level Anomalies, define the function in Define variable and Select analysis type, then the period. Click on "next" for selecting the geographical area, and limits of the variable (here, Color fill levels is set as (-25,25,2) (30)).
The typhoon Nargis was formed in the north Indian Ocean in central Bay of Bengal on April 27, 2008. First classified as a tropical storm, and with an initial path to the north-west, it was turned to the north-east then east, heading towards the south-western coasts of Burma. It reached these coaslines on May 2 when being classified as a hurricane category 4 on the Saffir-scale Simpson scale. Very violent winds up to 240 km/h, waves of more than 3 m devastated, swept, flooded the delta region of the Irrawady, and caused casualties and considerable damage.
The path of the hurricane was superimposed on the map of the maximum of sea level anomalies, computed between April 28 and May 2, 2008, and implemented with the LAS. The path of the typhoon, if it not follows exactly all the reliefs revealed by positive sea level anomalies, seems to turn its trajectory toward the east by diverting from a negative sea level anomaly located further in north (in blue on the map). The typhoon is strengthening from a category 2 to 3 on the Saffir-Simpson scale, above a maximum of a positive sea level anomaly, centered at 90°E and 16 °N.
The maps of maximum wind speed modulus and significant wave heights made with the LAS between April 28 and May 2, 2008 show high amplitudes under the path of the typhoon: large areas with winds values exceeding 12 m / s and significant wave heights values more than 3 m.
Maxima of the significant wave heights (left) and of the wind speed modulus (right) computed from merged altimetry data over the period between the 28th of April and the 2nd of May 2008. For each variable, choose the "Maximum" function in Define variable and Select analysis type, and then the period. Click on "next" to choose the geographical area and limits of the variables.
Further information:
- Applications : Hurricanes
- Altimetry applications in videos: Monitoring Hurricanes
- Lively data, October 14, 2005 : Wind and waves.
- External websites:
- Nasa Earth Observatory, Cyclone Nargis
- Noaa/AOML Altimetry Products, several maps for the 1st May 2008 during the Cyclone Nargis in Indian Ocean (sea level anomalies, sea surface temperature, depth of the 26°C isotherm , hurricane heat potential).
 Use the Live Access Server