


News
Rough sea state during Carmen and Eleanor storms
In early January 2018, the two storms Carmen and Eleanor hit french coasts. Satellite and in-situ instruments were able to measure the waves height at the passage of these storms.

Credits @didierfouasson85, 2018.
In early January, the two storms Carmen and Eleanor lined up off the western european coasts and one after another, headed due east, south east, two days apart. In a few hours, on the day of January 1, 2018, the storm Carmen reached the whole country: first Brittany area early in the day before moved into Corsica at the end of the day. A new gust of wind followed very quickly: on the days of 02 and 03 January, Eleanor tracked up through a large part of the hexagon.
Waves and gusts caused damage to the coast and all along the land path of both storms. At sea, satellite and in-situ instruments were able to measure the waves height at the passage of these storms.
The in-situ <link http: candhis.cetmef.developpement-durable.gouv.fr campagne _blank external-link-new-window>buoy at 13 km off Cap Ferret (Gironde) from CANDHIS network measured significant wave height of more than 8 m, on January 1, 2018, at 05:00 pm (Figure 1 below).
The Sables d'Olonne (Vendée) <link http: refmar.shom.fr les_sables_d_olonne _blank external-link-new-window>tide gauge from the REFMAR network measured a surge between 0.6 m and 0.7 m in the morning of January 1, 2018 (Figure 2). Unlike storm Xynthia, in February 2010, the peak of the Carmen storm occurred during a low tide (Figure 2).
The Jason-3 (conventional altimeter) and Sentinel-3A (SAR altimeter) satellites flew over the Bay of Biscay area as the storm occured. For example, Jason-3 measured a 9.7m wave off Ãle de Ré (Charente Maritime) on January, 1, 2018, 8:25 am (pass 248, cycle 0069).
Significant Wave Heights from in-situ CANDHIS buoys
<link file:23272 blank>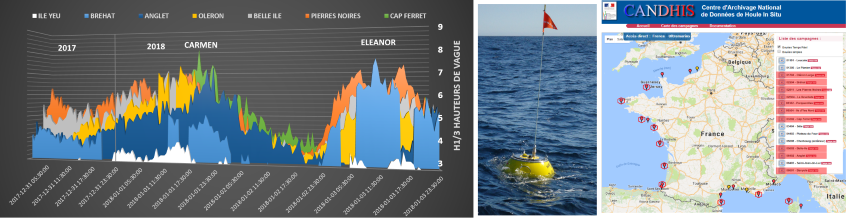 |
Figure1: Significant Wave Heights (H1/3) measured from buoys on CANDHIS network when the stroms Carmen and Eleanor hit the french coasts in early January 2018. An another plot is available here for 3 buoys off Medirranean coasts (Banyuls, Porquerolles et La Revellata). Credits CANDHIS (plot and interface) and CEREMA (photo on the buoy, in the middle). |
Sea level due to tides and surges from REFMAR tide gauges
<link file:23276 blank>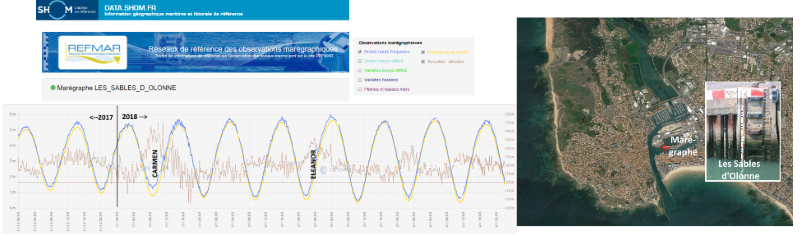 |
Figure2: Visualisation Interface for tide gauges data from REFMAR network, SHOM (left). The selected tide gauge is located in Les Sables d'Olonne as the storms occured. Credits SHOM-CCI Vendée. |
Significant Wave Heights Jason-3 and Sentinel-3A satellites
<link file:23274 blank>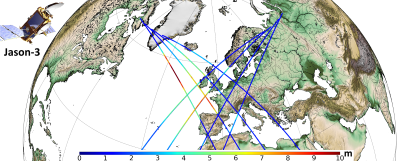 | <link file:23273 blank>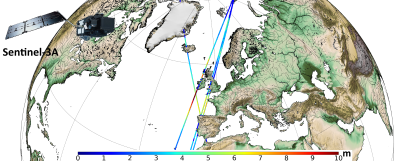 |
Figure3: Significant Wave Heights (H1/3) measured by Jason-3 (left) and Sentinel-3A (right) as Carmen et Eleanor, at the passage of the storms, between 2017/12/31 and 2018/01/03. Credits EU Copernicus Marine Service. | |
Further information
- on <link http: www.meteofrance.com externe tx-glossary>Météo France website (in french): <link http: www.meteofrance.fr actualites _blank external-link-new-window internal link in current>Décryptage, les dernières tempêtes (04/01/2018)
- Data access:
- <link http: marine.copernicus.eu services-portfolio access-to-products _blank external-link-new-window>Significant wave heigths from Jason-3 and Sentinel-3A, European Copernicus Marine Service
- <link http: www.odatis-ocean.fr _blank external-link-new-window>Sea level (tides and surges) from REFMAR network on ODATIS catalogue
- <link http: www.odatis-ocean.fr _blank external-link-new-window>Significant wave heights from CANDHIS network on ODATIS catalogue
- Links:
- file:23278 1200x674