


Sea ice extent as observed by altimeters
Satellite monitoring of sea ice provides key indicators to assess the extent of climate change and give us a true picture of our planet.
Satellite altimetry with high inclination orbit allowing an optimal coverage in high latitudes, enables to determine variations in sea ice throughout the year and over longer periods. The 35-day repeat orbit follow by ERS1&2 from 1991, Envisat from from 2002 and now by Saral is a great opportunity to extend the repeat observations. The combined use of Ka-band observations from Saral (from 2013) and Ku-band observations from Europe’s Cryosat satellite (from 2010) are giving scientists new tools for analysis. First, they are being used to map fracturing of ice to gauge sea ice status and tell us more about how it is evolving over time. Fractured ice usually melts faster than an unbroken surface. Second, they allow us to measure ice thickness more precisely.
Arctic
In the last 20 years, the extent of sea ice has decreased significantly as a result of climate change. The decrease of the sea ice extent is a problematic phenomena since the ice reflects the sun energy. Without ice, the sun radiations are absorbed by the ocean, thus increasing the warming.
The decline of the sea ice extent has accelerated since 2006. The maps below plotted with Envisat data show a low sea ice extent record in Arctic on September 2007. According to the National Snow and Ice Data Center this surface is estimated at 4.10 million km². September 2010 is the third low sea ice extent record with 4.60 million km² and 2011 shows a comparable low record than 2007. By September 2012 sea ice coverage was at the lowest level ever seen, dropping below 4 million square kilometres -3.3 millions km², just half what it was in the 1970s. Envisat was enable to measure and plot these low records (see below).
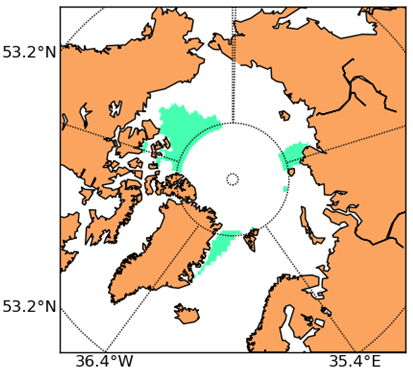
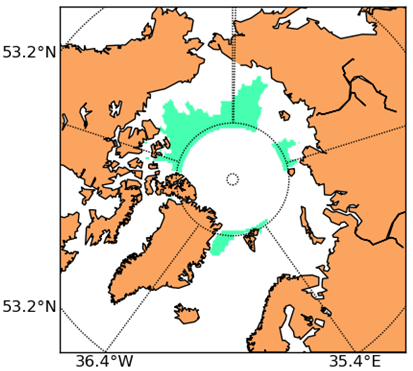
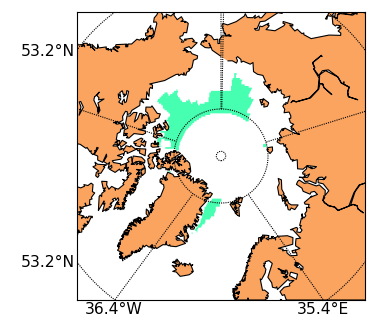
Monthly sea ice coverage averaged in 1°x1° boxes over September 2007 (left) September 2010 (middle) and September 2011 (right) derived from Envisat RA-2 data. White area is open water. (Credits CLS).
More recently and from 2013, Saral contributes to measure the sea ice extent. A detailed analysis of the Saral/AltiKa altimetric radar waveform (return echo shape) and its characteristic help to define a new algorithm to discriminate sea ice from ocean and allows to deduce sea ice extent (see the animation below).
In 2013 and 2014, the ice extent recovered slightly from the catastrophic decline observed in 2012, but at 5 million square kilometres it is still below the average of the last 30 years. In 2015, the minumum dropped to 4.4 millions km².
Proportion of ice measurements from Saral/AltiKa waveforms classification from March 2013 (available by playing the animation). Waveform classification in function of the return echo shape enables to discriminate sea ice from ocean and allows to deduce sea ice extent . Credits CLS/CNES.
Antarctic
Geographically, the environment between Arctic and Antarctic is quite different: the Antarctic is surrounded by sea ice whereas in the Arctic, the sea ice is surrounded by land. Arctic and Antarctic show opposite trends in sea ice extent.
The animation made from waveform classification of Saral/AltiKa measurements (see above) shows an high extent on October 2015. According to the National Snow and Ice Data Center, the Antarctic sea ice extent reached a record high extent on September 2014.
Further information:
- Missions: Saral
- Saral/AltiKa freeboard maps
- Multimedia Galery: Sea ice topic
- Image of the month:
- Data: Use the Products Guide to find the products suit to ice studies (PEACHI project, SGDR, ...)
- News (Sept. 2011): Arctic Sea ice extent near the low 2007 record
- Arctic sea ice new and analysis on the National Snow and Ice Data Center (NSIDC) website
Applications
 Ocean .
- Coastal ocean applications .
- Ice and Cryosphere .
- Ice sheets .
- Sea ice .
- SARAL/AltiKa Sea Ice results.
- Ice on Lake Baikal.
- Sea ice extent as observed by altimeters.
- Climate .
- Atmosphere, wind and waves .
- Geodesy and geophysics .
- Biology .
- Navigation by area .