


Analysis of climate feedback PArameter Changes from Heat Evolution (APACHE)
Effective Climate sensitivity: a study of climate feedback parameter’s time variation
In the context of climate change and the rise of greenhouse gases concentration in the atmosphere, the concept of climate sensitivity emerges as a crucial quantitative measure of the warming associated with increased atmospheric GHG concentration. Understanding climate sensitivity is essential for studying current and future climate changes. The key component in this understanding is the climate feedback parameter, denoted as λ, which describes the Earth’s radiative response to changes in global average 2-metre air temperature. Equilibrium Climate Sensitivity (ECS) represents the Earth’s global average surface temperature reached after an instantaneous doubling of atmospheric CO2 concentration compared to pre-industrial levels. The relationship between ECS and the λ parameter is direct: a less negative λ value indicates a weaker radiative response of the Earth to a given change in 2-metre air temperature meaning the Earth radiates less energy towards space when it warms leading to greater warming for the same amount of GHG concentration in the atmosphere and thus a greater climate sensitivity to GHG concentrations. Defining and understanding the climate feedback parameter λ is fundamental for accurately assessing ECS and the broader implications for climate change. Currently λ is poorly constrained and subject to significant uncertainties meaning the ECS, which depends on λ, is also highly uncertain. Reducing the uncertainty in ECS estimates involves better constraining λ. This is challenging because λ cannot be directly measured and must therefore be estimated through approaches based on the global energy balance (Otto et al. 2014, Sherwood et al. 2020), which is defined as ΔEEI = ΔF + λΔT, with EEI the Earth Energy Imbalance, F the radiative forcing and T the global mean surface temperature.
From changes in radiative forcing, temperature and earth energy imbalance to climate feedback parameter
To estimate the λ parameter through the global energy balance equation, variations in radiative forcings, temperatures and planetary heat uptake relative to a defined reference state are quantified. To address uncertainties about the reference state, a method of linearly regressing the radiative response EEI(t) - F(t) against temperature T(t) is used, as in Barnes and Barnes (2015), Chenal et al. (2022), Forster and Gregory (2006) and Gregory et al. (2019).
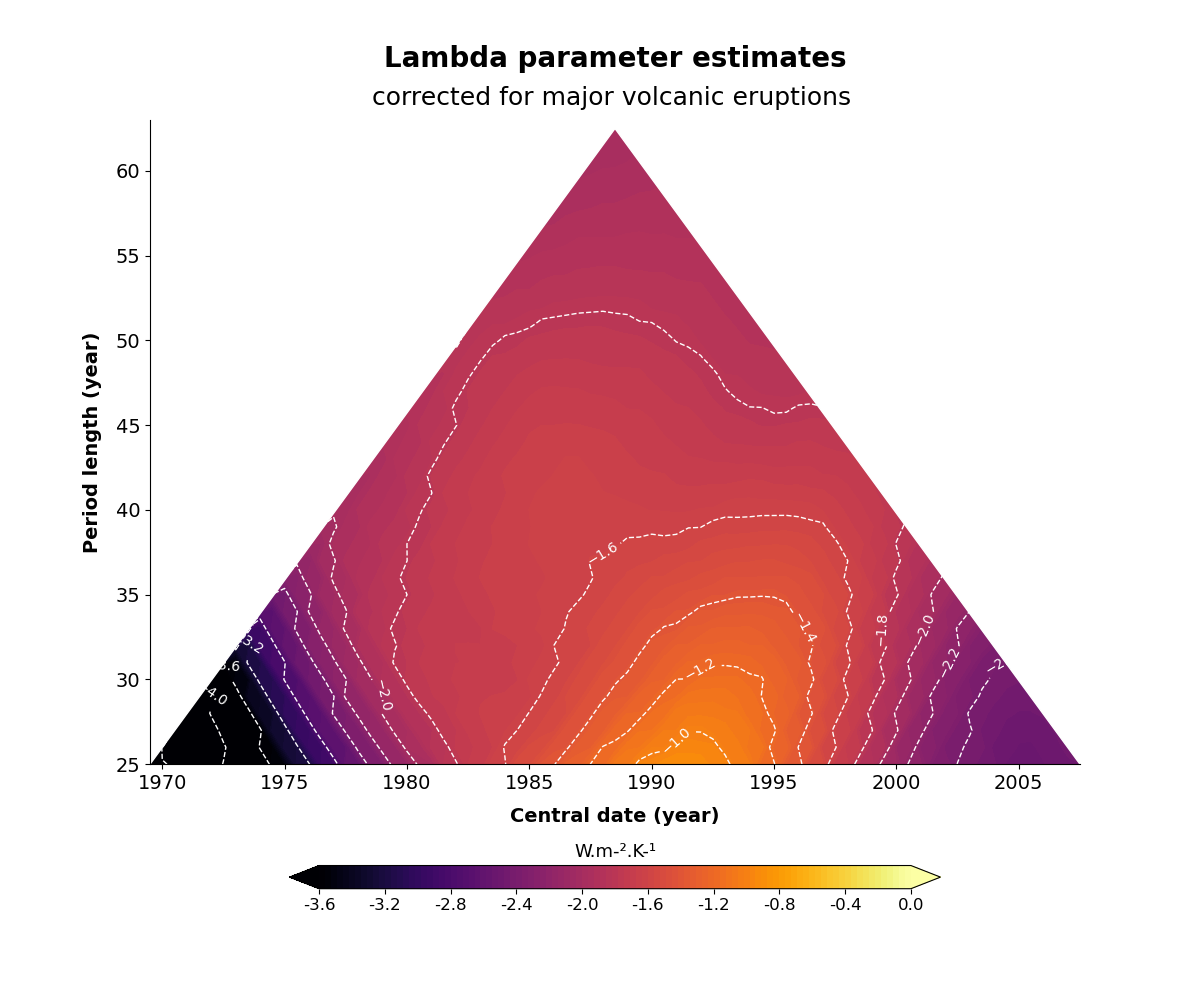
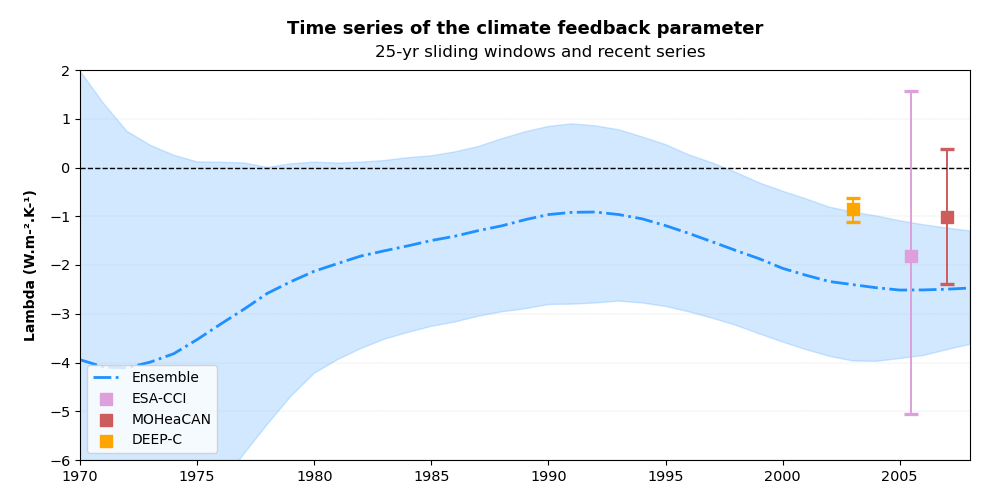
Climate models suggest that λ varies over time. Recently, a regression approach provided the first observational estimate of temporal variations of λ since 1970 (Meyssignac et al., 2023). In this approach, based on global energy balance, ΔEEI is regressed on ΔF and ΔT for any periods longer than 25 years since 1957, estimating λ variations between 1970 and 2005. This approach uses recent observational data to study climate changes, avoiding reliance on poorly known historical reference states. Additionally, λ has been estimated using three other EEI datasets over more recent periods (24 to 35 years), including the MOHeaCAN EEI product series.
Correlation between climate feedback parameter time-variation and the Pacific Decadal Oscillation
This study allows for the exploration of temporal variations of λ before the 2000s. λ increased sharply in the mid-1970s until the 1990s, and has been decreasing continuously since then meaning the climate system is less sensitive to GHG concentrations today than in the 1970s .
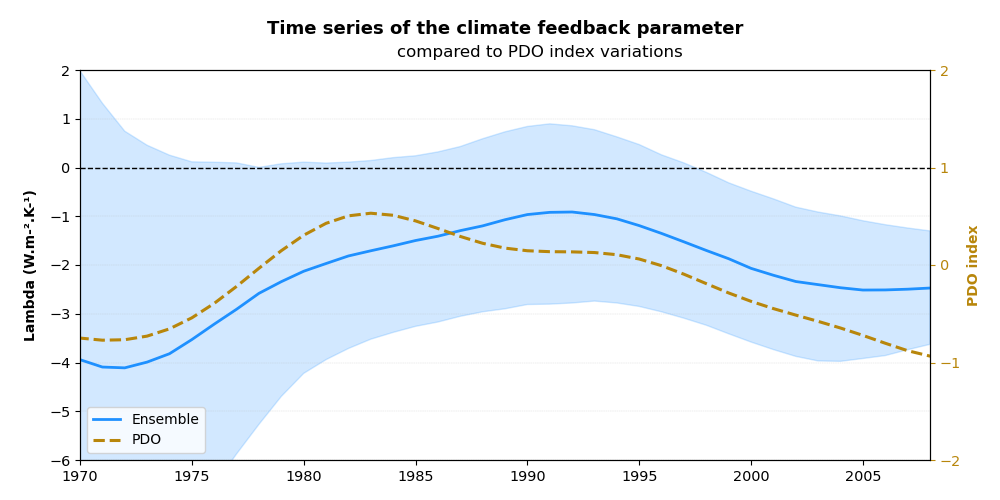
The correlations between globally gridded SST and the λ time series highlight a significant correlation with the PDO in the Pacific, clearly marked over the period 1970-2005 and still visible over the period 1980-2005. Only the correlation with the PDO is significant, indicating that the multidecadal variations of λ are synchronous with the PDO. This leads to the conclusion that the temporal variations of λ are closely linked to the PDO, not only during the hiatus period, but also at multidecadal time scales.
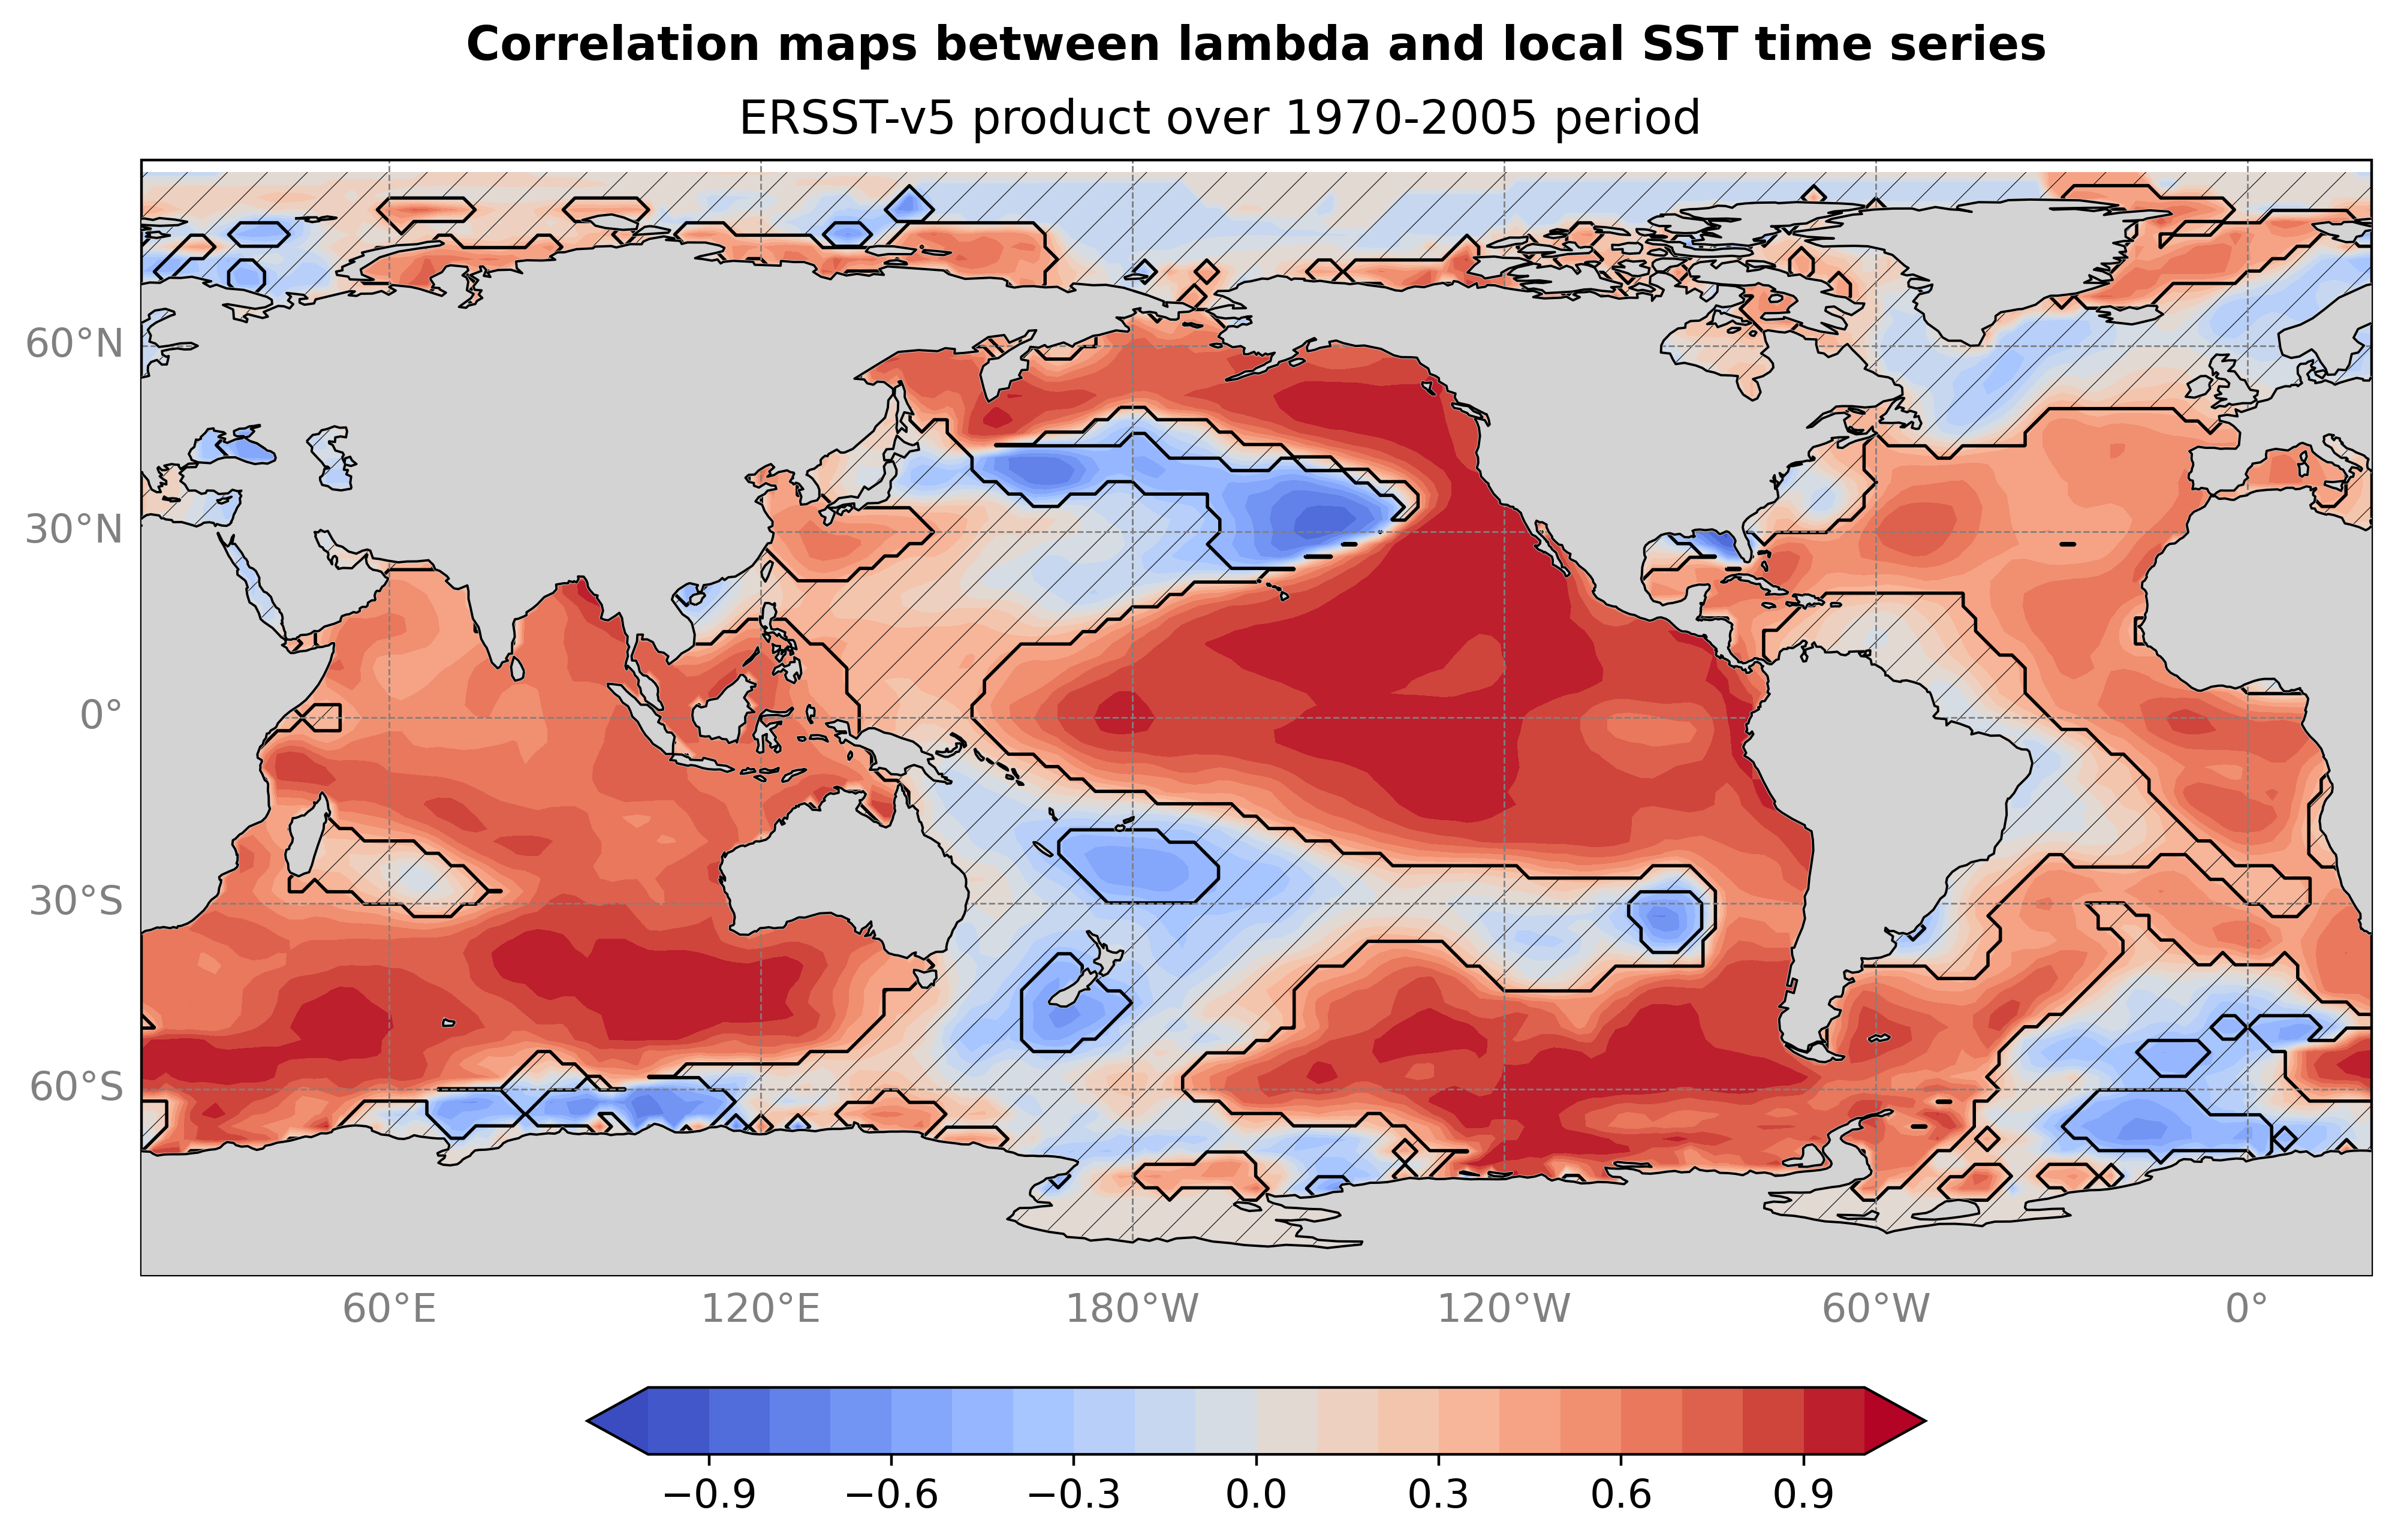
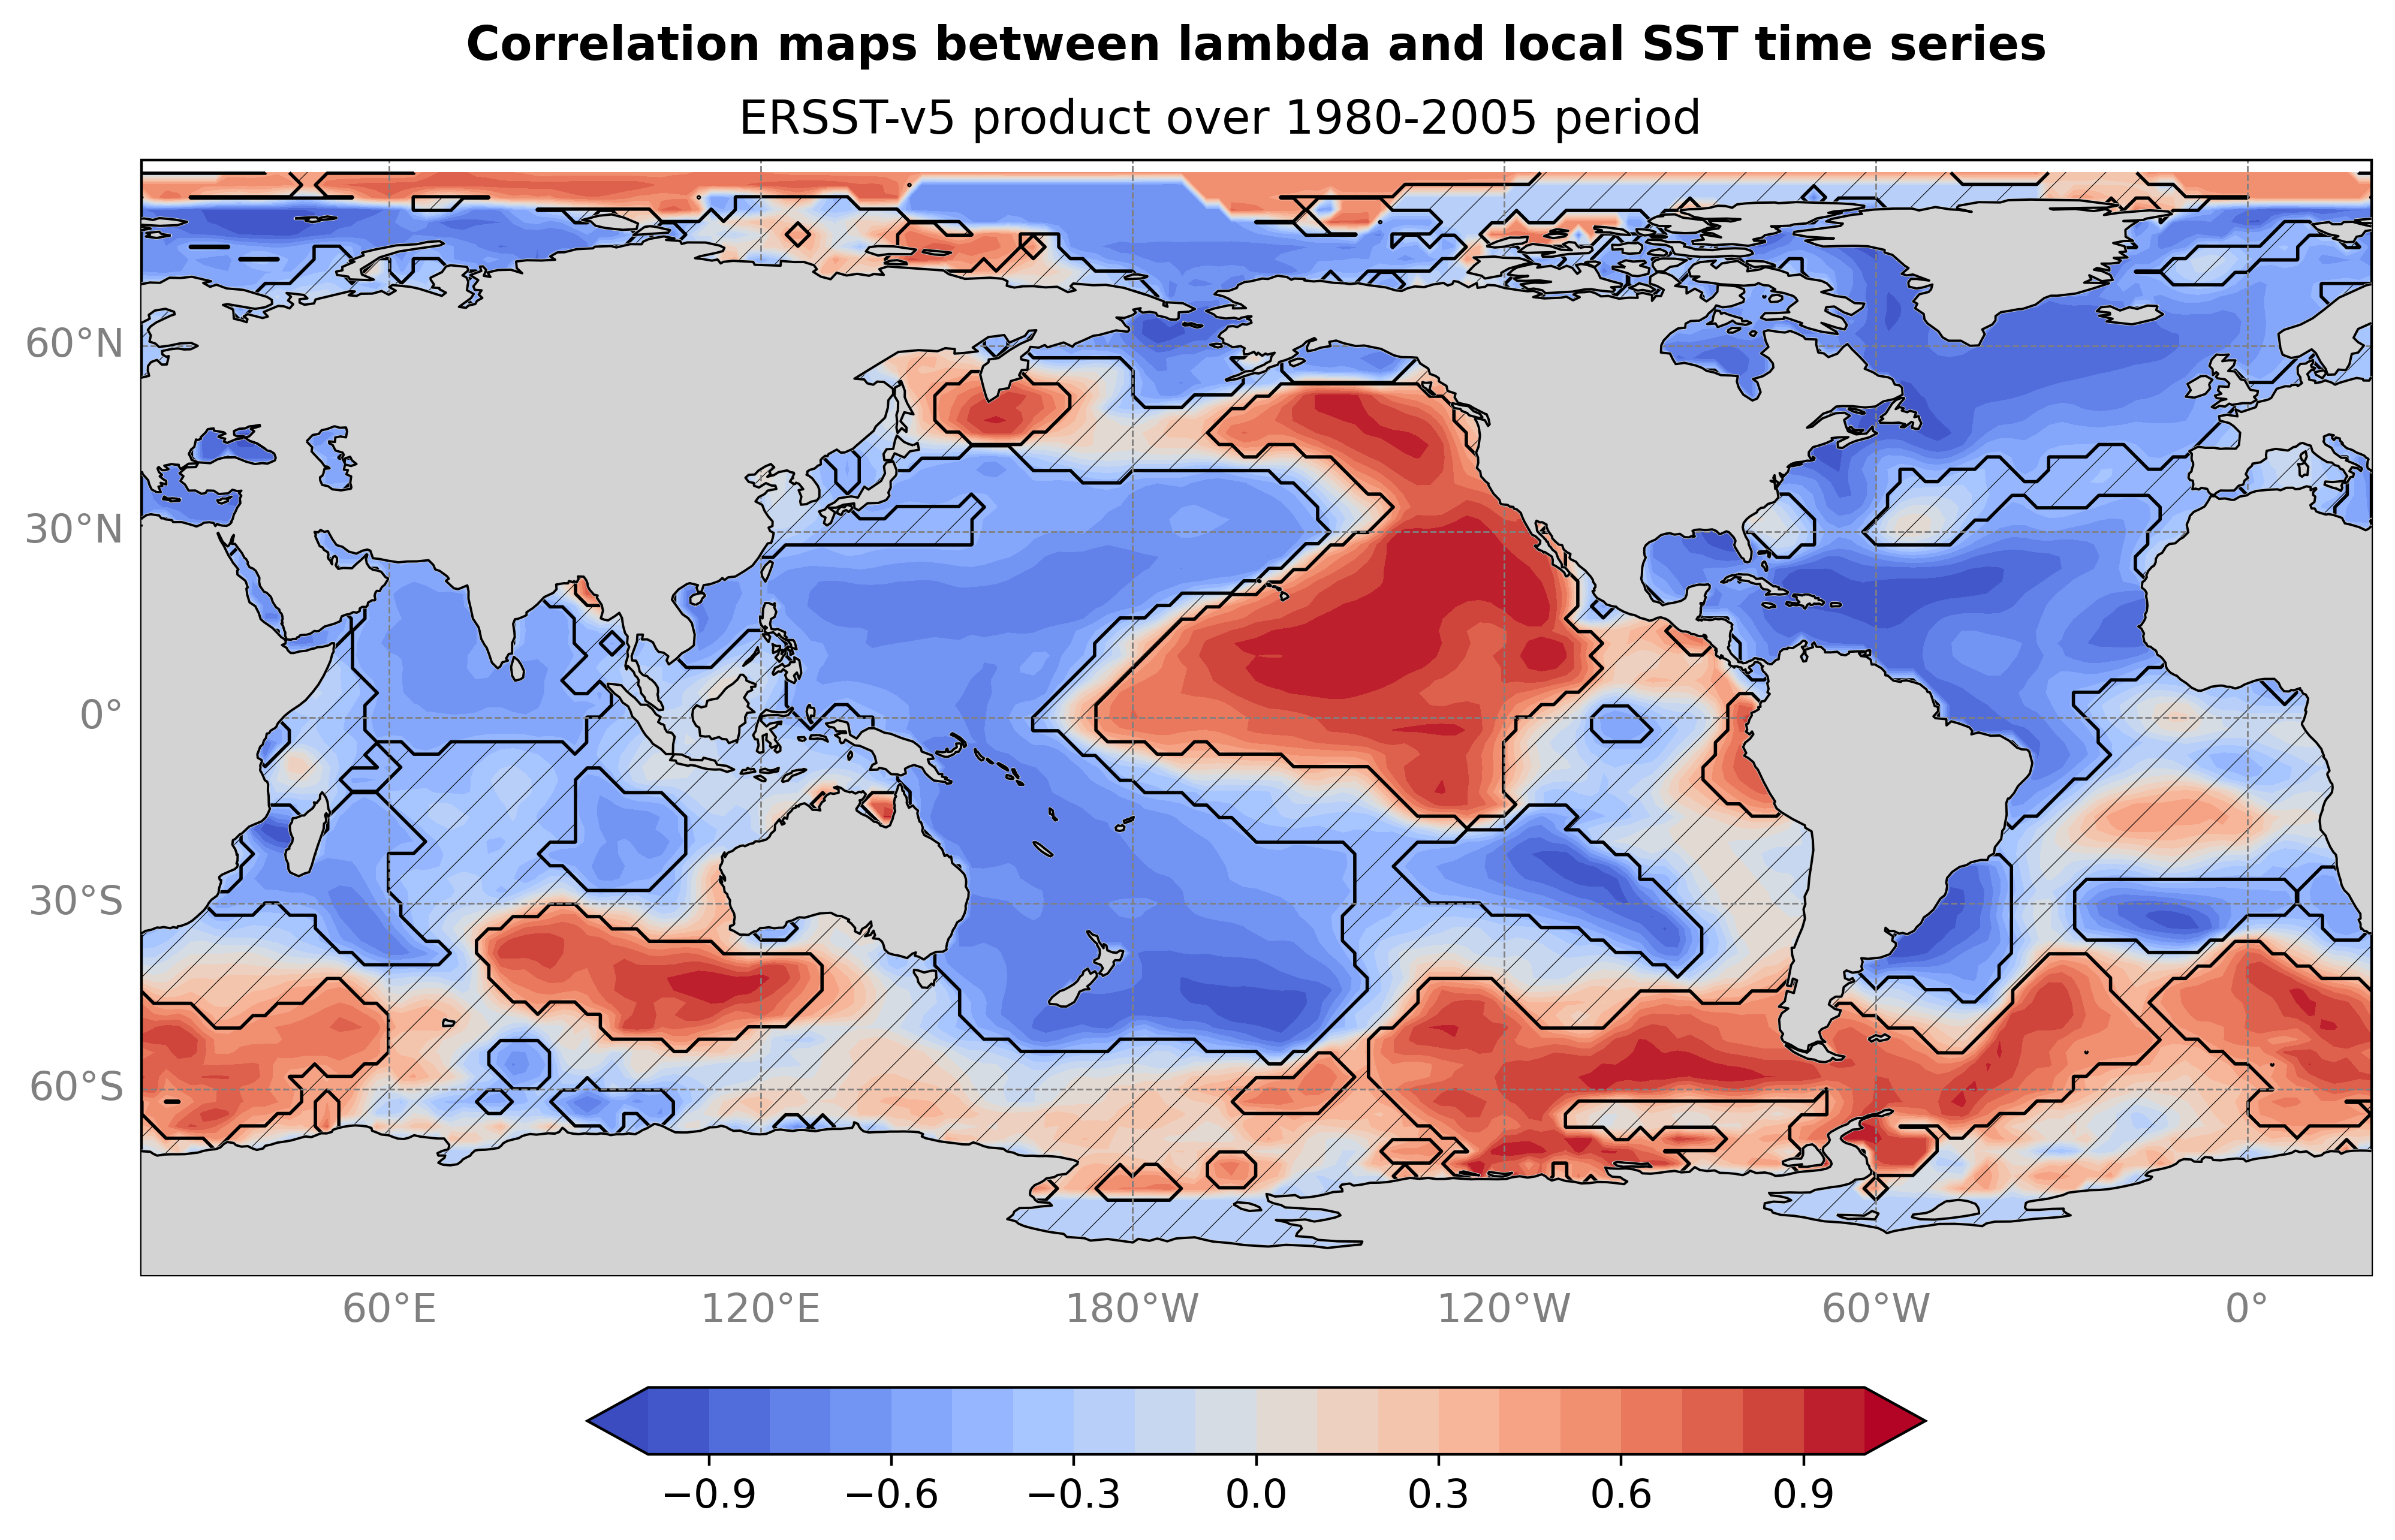
Correlation maps obtained between λ time series estimated over 25-year windows and SST gridded and filtered via a 15-year low-pass filter. On the left, the period considered is 1970-2005, and on the right 1980-2005. λ is estimated from HadCURT5 temperatures, and the SST data come from the ERSSTv5 dataset available at 2° resolution.
The product
Users will be mainly interested in:
- Time series of climate feedback parameter λ
- The uncertainties associated with these estimates.
Data used to calculate the indicators are given in full transparency. The input variables used to compute λ are gathered in the secondary product called "extended product". Thus users can rebuild their own indicators.
Product versions
Consult the table below for the different versions of the product.
DOI and metadata
This product is referenced with a DOI: https://doi.org/10.24400/527896/a01-2024.006
Product access and condition of access
The product (NetCDF file) can be downloaded in open access on the HTTPS server or the Thredds Data Server (with credentials).
The product is available free of charge for any project or study, and delivered as stated in the license agreement.
Citation
If you use the data, please cite: "The Climate sensitivity product was produced by Magellium/LEGOS and distributed by AVISO+ (https://aviso.altimetry.fr) with support from CNES (https://doi.org/10.24400/527896/a01-2024.006 version 1.0)"
Contacts
For any technical issues or additional information related to the product, users are advised to contact AVISO: aviso(at)altimetry.fr
Acknowledgment
This work has been supported by CNES in the framework of the GIECCO project. We would also like to thank Jonathan Chenal for his invaluable help during the development of the product.
References
- Barnes, E. A., and R. J. Barnes, 2015: Estimating Linear Trends: Simple Linear Regression versus Epoch Differences. J. Climate, 28, 9969–9976, https://doi.org/10.1175/JCLI-D-15-0032.1
- Budyko, M. I.: The effect of solar radiation variations on the climate of the Earth, Tellus, 21, 611–619, https://doi.org/10.3402/tellusa.v21i5.10109 , 1969.
- Chenal, J., Meyssignac, B., Ribes, A., and Guillaume-Castel, R.: Observational Constraint on the Climate Sensitivity to Atmospheric CO2 Concentrations Changes Derived from the 1971–2017 Global Energy Budget, J. Clim., 35, 4469–4483, https://doi.org/10.1175/JCLI-D-21-0565.1 , 2022.
- Forster, P. M. F. and Gregory, J. M.: The climate sensitivity and its components diagnosed from Earth radiation budget data, J. Clim., 19, 39–52, 2006.
- Gregory, J. M., Griffies, S. M., Hughes, C. W., Lowe, J. A., Church, J. A., Fukimori, I., Gomez, N., Kopp, R. E., Landerer, F., Cozannet, G. L., Ponte, R. M., Stammer, D., Tamisiea, M. E., and van de Wal, R. S. W.: Concepts and Terminology for Sea Level: Mean, Variability and Change, Both Local and Global, Surv. Geophys., 40, 1251–1289, https://doi.org/10.1007/s10712-019-09525-z , 2019.
- Meyssignac, B., Chenal, J., Loeb, N., Guillaume-Castel, R., and Ribes, A.: Time-variations of the climate feedback parameter λ are associated with the Pacific Decadal Oscillation, Commun. Earth Environ., 4, 1–10, https://doi.org/10.1038/s43247-023-00887-2 , 2023.
| Product | Version | Publication date | Temporal coverage | Documentation | Product access | ||
| Product user manual | Algorithm Theoretical Basis Document | HTTPS | Thredds Data Server | ||||
| APACHE product | 1.0 | January 2026 | From 1957 to 2019 | PUM | ATBD | open access | TDS |
Data
- Products guide.
 Products .
- Sea surface height products .
- Value-added products .
- Wind/wave products .
- Auxiliary products .
- Ice products .
- Ocean indicators products .
- El Niño Southern Oscillation - ENSO.
- Mean Sea Level .
- Kuroshio.
- Analysis of climate feedback PArameter Changes from Heat Evolution (APACHE).
- Ocean Heat Content and Earth Energy Imbalance .
- Barystatic and manometric sea level changes from satellite geodesy.
- Ionian Sea circulation.
- Ocean data challenges .
- Tide Gauges products.
- Data access .
- Product information .
- CALVAL .