


Ocean heat content (OHC) change and Earth energy imbalance (EEI)
Over the last decades, greenhouse gases and aerosol concentrations have been increasing in the atmosphere, disrupting the balance in the Earth system between incoming and outgoing radiation fluxes. Part of the outgoing longwave radiation being blocked, the system has reemitted less energy towards space than it has received from the Sun. This imbalance at the top of the atmosphere, known as the Earth energy imbalance (EEI), is about 0.5–1 W m−2 (von Schuckmann et al., 2016).
Positive values of the EEI indicate that an excess of energy is stored in the climate system. With its high thermal inertia and its large volume, the ocean acts as a buffer, accumulating most of the excess of energy in the form of heat. The other climate reservoirs, the atmosphere, land, and cryosphere, play a minor role in the energy storage at seasonal and longer timescales. As a result, the ocean heat uptake prevails in the global energy budget on timescales longer than several months. The global ocean heat uptake is therefore a good proxy of the EEI variations.
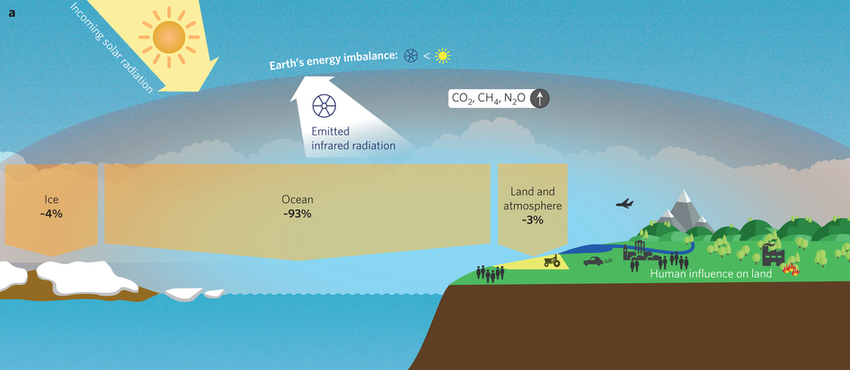
Principle of the imbalance of energy in the Earth system (from von Schuckmann et al., 2016)
The Ocean Heat Uptake (OHU) is positive when heat enters the ocean and negative when heat leaves the ocean. It is the time derivative of the Ocean Heat Content (OHC). OHC change time series may be inferred by different approaches which are complementary (Meyssignac et al., 2019):
- (1) direct measurement of temperature–salinity profiles,
- (2) re-analysis,
- (3) the ocean surface net flux from satellite observations, and
- (4) the space geodetic approach.
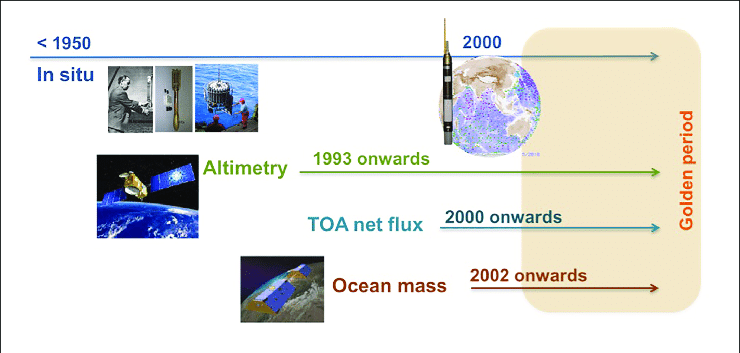
Evolution of in situ and remote sensing observing systems for the estimation of global ocean heat content. Top-of-atmosphere (TOA) net flux is derived from the CERES instruments. Ocean mass variations are observed from space gravimetry. (from Meyssignac et al. 2019).
Here, OHC change is derived from the space geodetic method. It relies on spatial observations of the sea level and the ocean mass from altimetry and gravimetry. This indirect method is applied:
> over the Global Ocean, whose role is essential in the climate system
> at regional scale, to study local mechanisms of the OHC
References:
Marti, F. et al.: Monitoring the ocean heat content change and the Earth energy imbalance from space altimetry and space gravimetry, Earth Syst. Sci. Data, https://doi.org/10.5194/essd-2021-220, 2022
Meyssignac, B. et al: Measuring Global Ocean Heat Content to Estimate the Earth Energy Imbalance, Front. Mar. Sci., 6, 432, https://doi.org/10.3389/fmars.2019.00432, 2019.
von Schuckmann, K. et al.: An imperative to monitor Earth's energy imbalance, Nat. Clim. Change, 6, 138, https://doi.org/10.1038/nclimate2876, 2016.
Data
- Products guide.
 Products .
- Sea surface height products .
- Value-added products .
- Wind/wave products .
- Auxiliary products .
- Ice products .
- Ocean indicators products .
- Ocean data challenges .
- Tide Gauges products.
- Data access .
- Product information .
- CALVAL .