


El Niño Southern Oscillation (ENSO) Ocean Indicator product
Type of dataset: Ocean Indicator product
Digital Object Identifiers (DOIs):
- El Niño Southern Oscillation (ENSO) Ocean Indicator : 10.24400/527896/a01-2025.008 - more metadata
Condition of access: distributed by AVISO under standard AVISO+ license agreement.
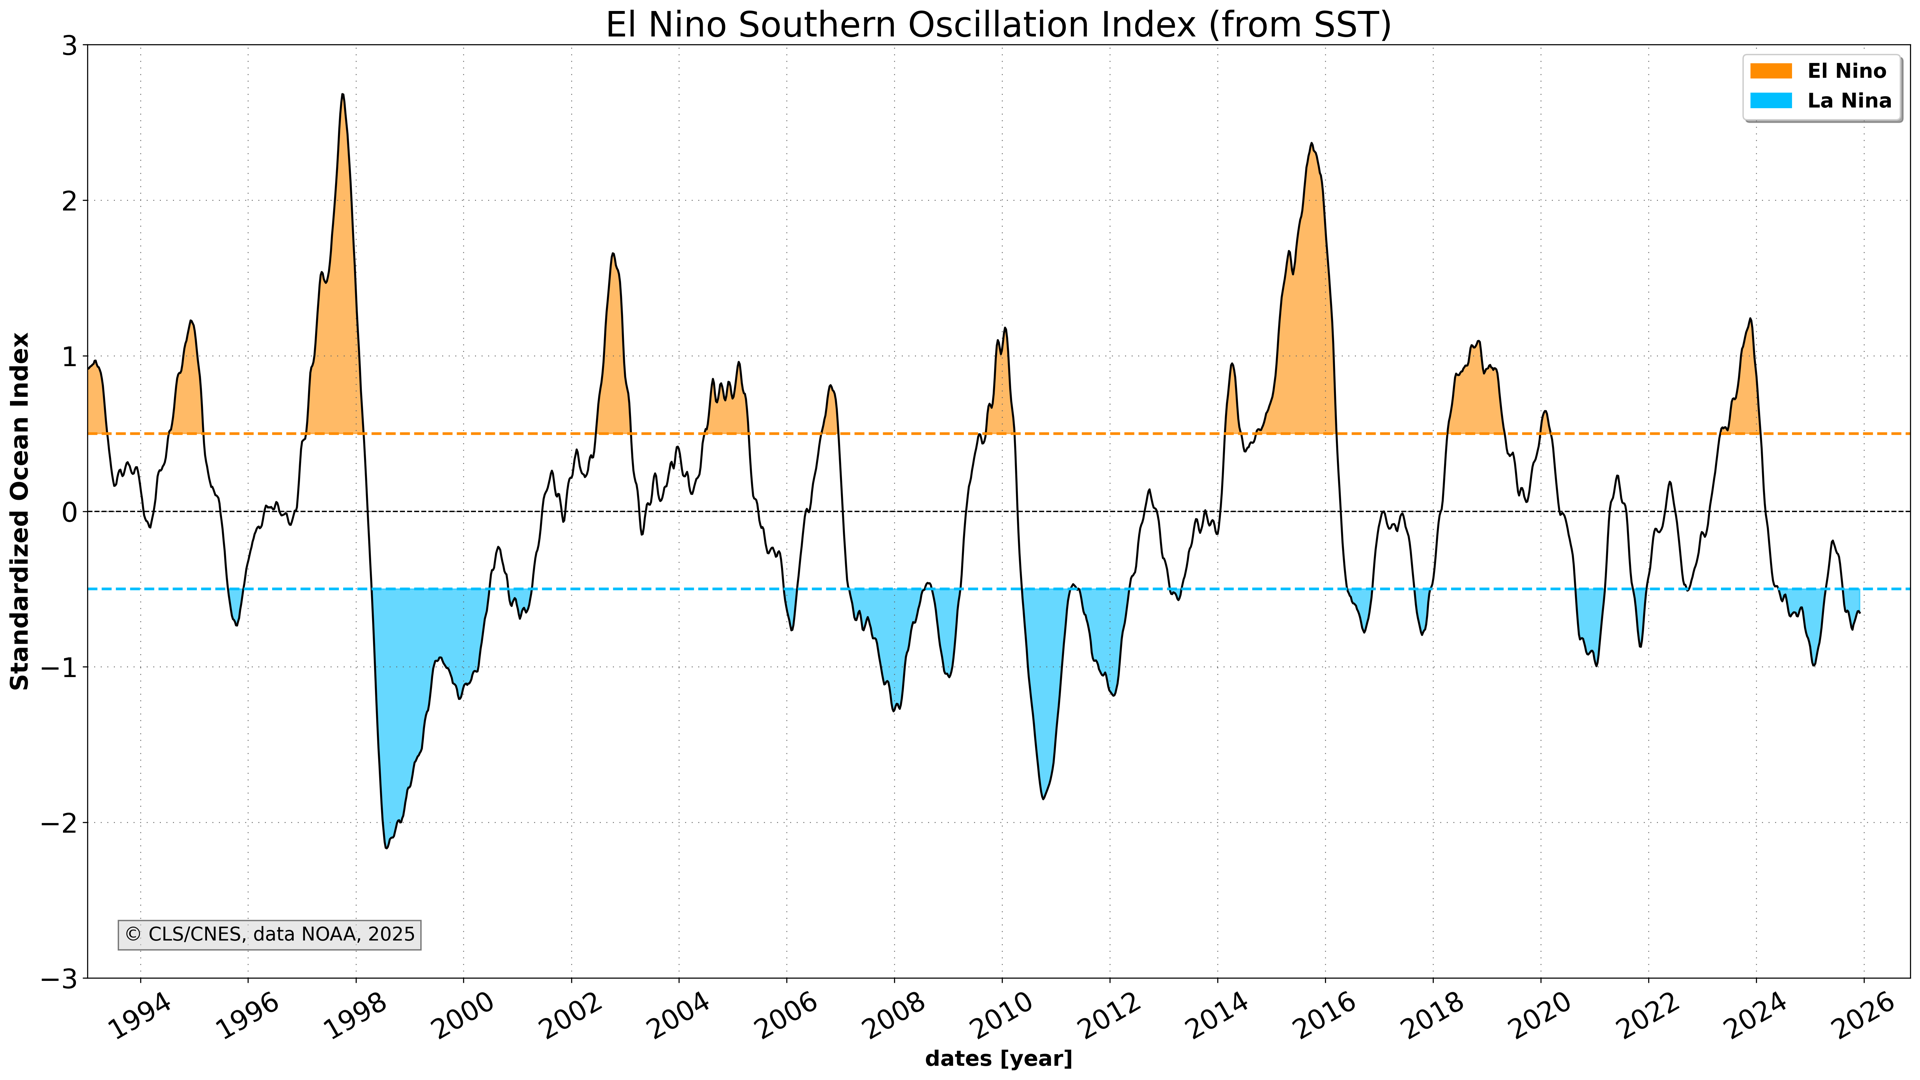
Contents: Monthly time series are computed and normalized.
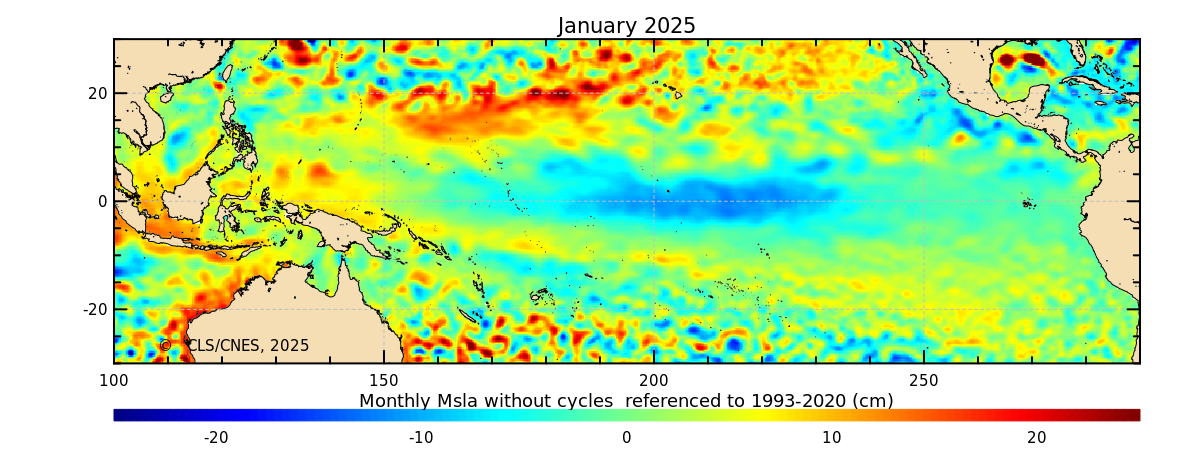
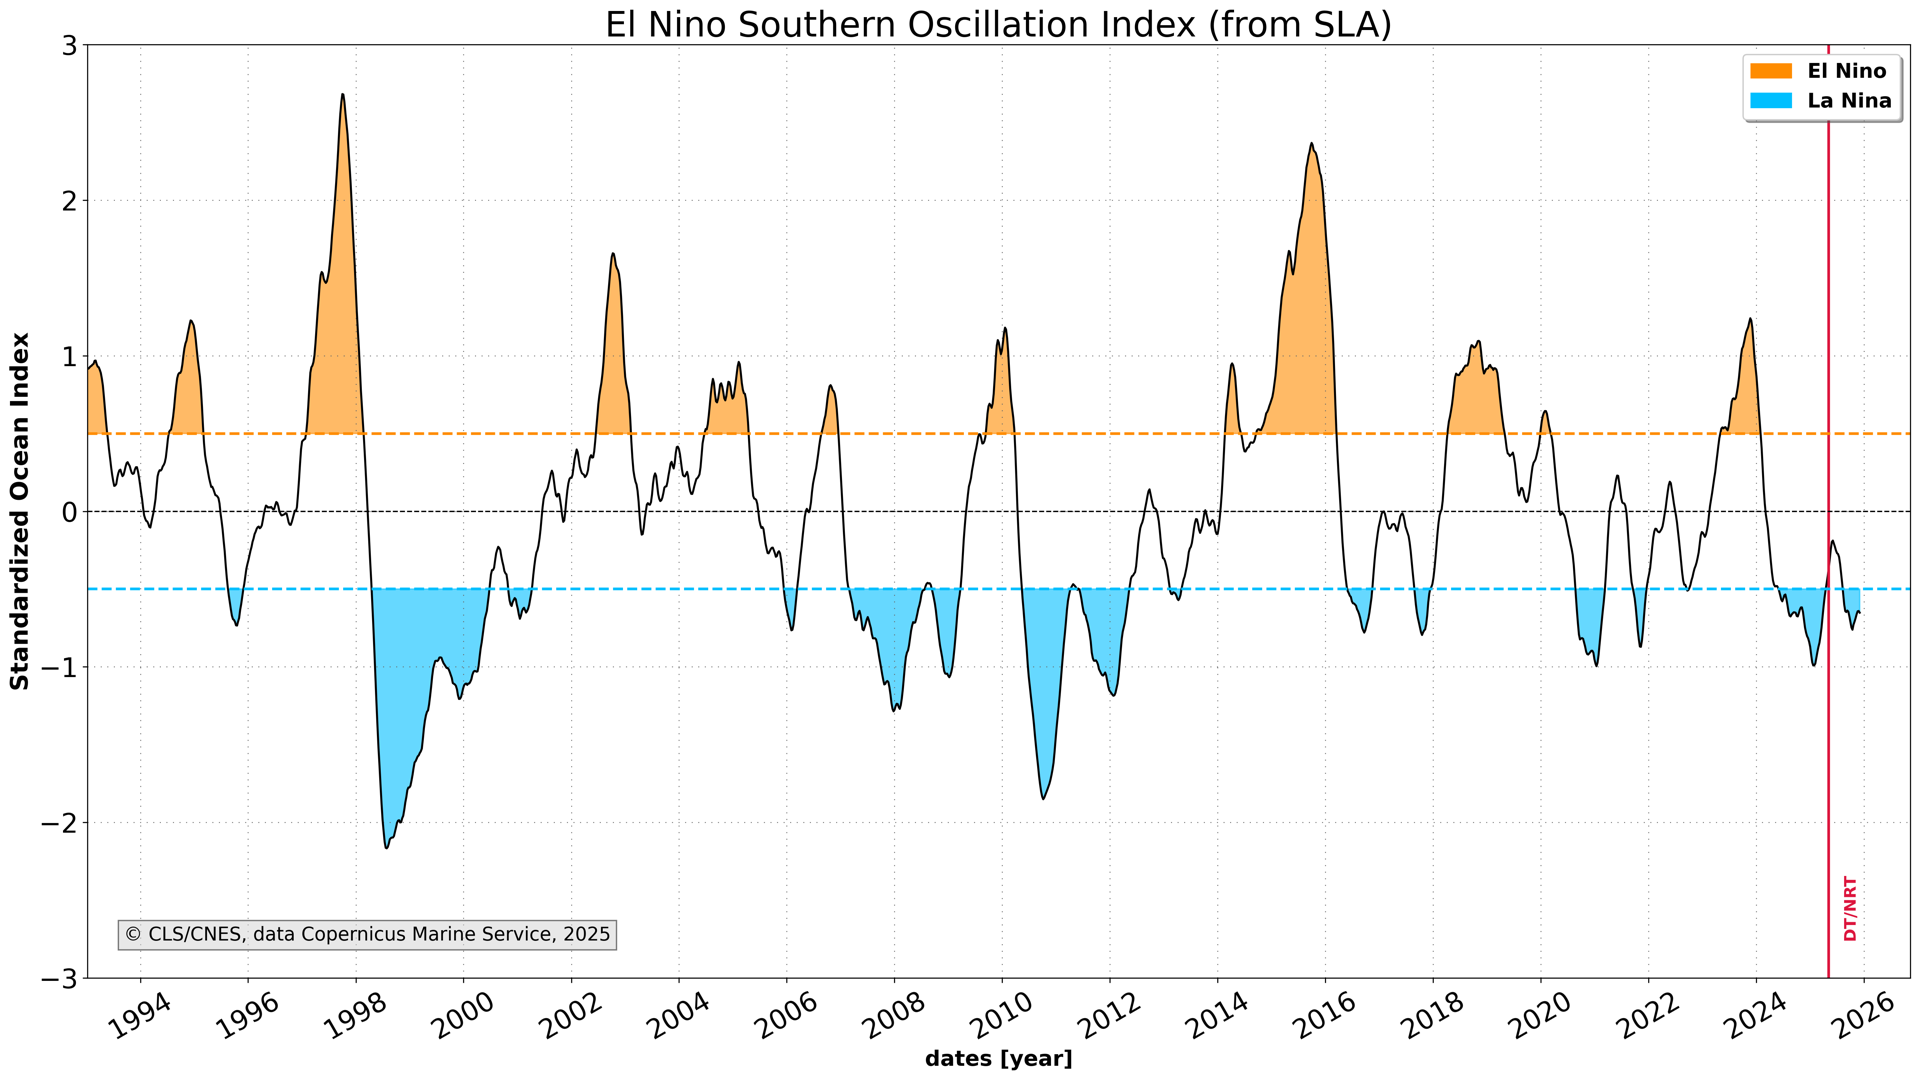
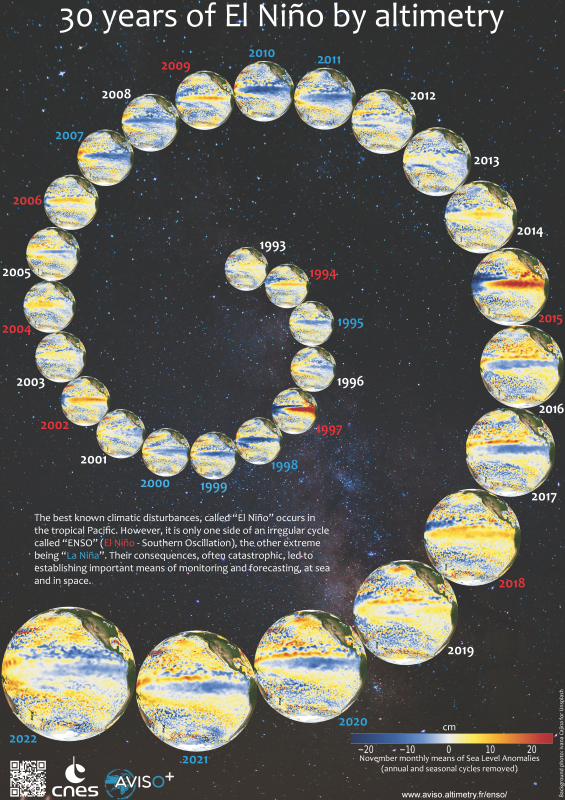
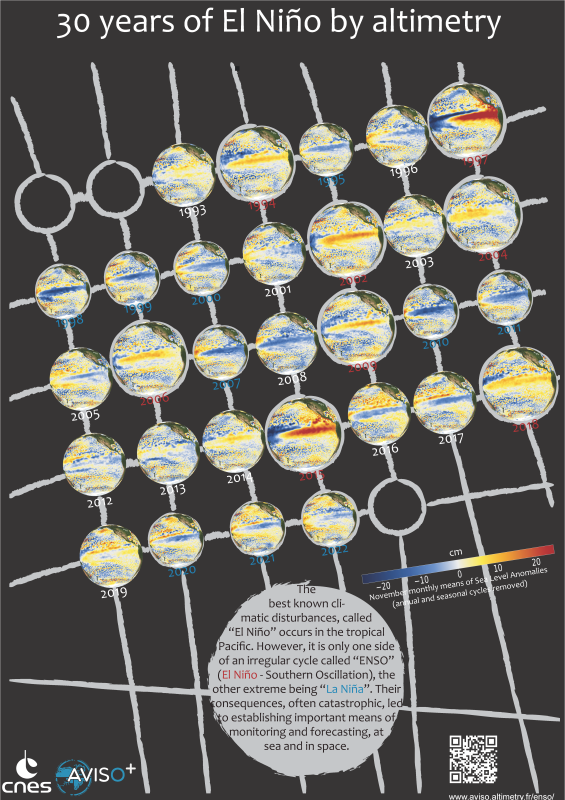
Description: The ENSO (El Niño Southern Oscillation) index is based on the altimeter sea level anomalies over the Nino3.4 region in the Pacific ocean. The annual, seasonal cycles and 60-day signal have been filtered out and the sea level trend has been removed. Monthly time series are computed and normalized.
Geographic coverage: nino3.4.
Citation: "The ENSO (El Niño Southern Oscillation) Ocean Indicator product is produced and made freely available by AVISO and DUACS teams". AVISO/DUACS, 2025. El Niño Southern Oscillation Ocean Indicator product (vDT2024) [Data set]. CNES. https://doi.org/10.24400/527896/A01-2025.008
Resources:
- El Niño Southern Oscillation Index product User Handbook
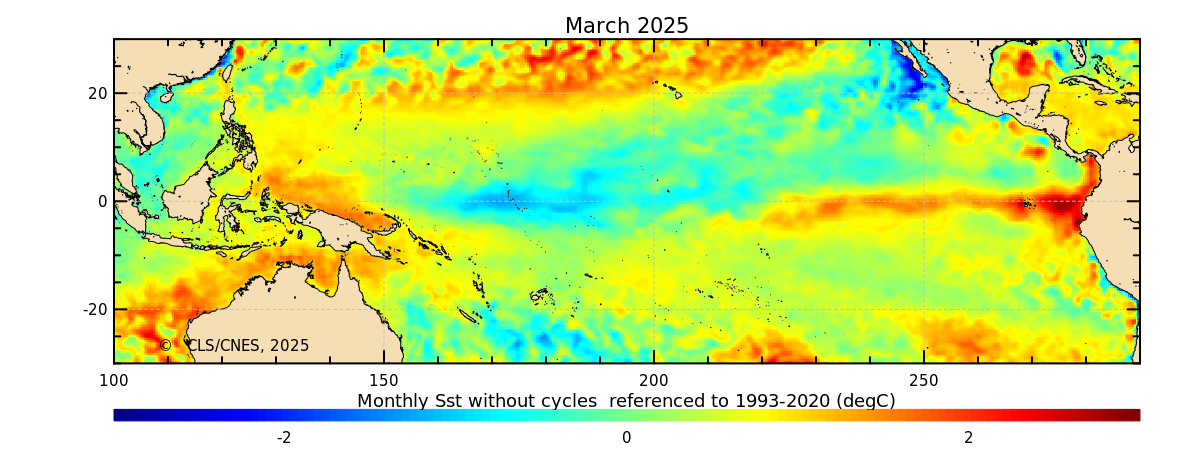
- A map of Sea Surface Temperature is also available
- See also previous maps for MSLA and Sea Surface Temperature
- A standardized Sea Surface Temperature is also available
- link to ‘Applications’ page
- Posters: Click on each image to download the posters
El Nino Southern Ocean Index product
| Product files | Version | AVISO Distribution services | Delivery delay | File size | Handbook |
|---|---|---|---|---|---|
| MSLA time series | vDT2024 | https server or CNES AVISO THREDDS Data Server access: https://tds%40odatis-ocean.fr:odatis@tds-odatis.aviso.altimetry.fr/thredds/catalog/el-nino-southern-oscillation/catalog.html |
monthly | 30 Kb | El Niño Southern Oscillation Index product Handbook |
| SST time series | 30 Kb |


