Editing diagnostics
add_editing() method.Add the computation of a new editing field. Editing components are
applied one after the other in the given order.
After computation the generated field will be available as a raw data and
can be used in other statistics.
Editing data and plots can be accessed or created using special keywords:
* plot parameter:
* plot="time" (default): graphical along time data
* plot="map": along track data
* plot="editing": data invalidated by each editing component
* group parameter:
* group="all" (default): data from all components
* group="valid": data limited to unedited values
* group="name": data invalidated by the provided component
* group=["name1", "name2"]: data invalidated by the provided components
Parameters
----------
name
Name of the diagnostic.
field
Resulting editing field.
components
Ordered list of editing components.
EditingComponent
each containing a list of invalidating conditions.Note
Editing components are applied one after each other on the unedited data resulting from the previous editing component.
Therefore, changing the order of editing components will change the result associated with each component but not the mask of unedited values.
Note
Once computed, generated editing fields are automatically added to
NadirData using the
add_raw_data() method and can be used in
other diagnostics as if this field existed in the data source.
Invalidity conditions
There are 4 kinds of conditions.
ClipCondition
ClipCondition is the basic condition invalidating
data using a single Clip.Basic clip condition: no parameter is required.
clip
Clip definition
Examples
--------
clip: ice_flag :== 1
Example
from casys.editing import Clip, ClipCondition

condition = ClipCondition(
    name="Wind speed out of range",
    clip=Clip("WIND_SPEED.ALTI :> 5")
)
RobustMeanStd
RobustMeanStd is an iterative processing,
invalidating, at each step, values “too far” from the global mean.
Compute mean and std
Invalidation outliers for which |values - mean| > (threshold * std)
Iterative processing, invalidating at each step the values "too far"
from the global mean.

Parameters
----------
clip
    Clip definition
nbr_iter
    Number of iterations
threshold
    At each iteration, invalidate outliers = values where
    ``|values - mean| > threshold * std`` (then compute mean and std again)
Example
from casys.editing import Clip, RobustMeanStd

condition = RobustMeanStd(
    name="RobustMeanStd invalidation",
    clip=Clip("sig0_ku"),
    nbr_iter=4,
    threshold=Clip("IIF(LATITUDE :> 0, 3, 2.5)"),
)
IterativeFilter
IterativeFilter is an iterative processing,
invalidating, at each step, values “too far” from the filtered values.
Compute the filter and std
Invalidation outliers for which |values - filter(values)| > (threshold * std)
Replace values by filter(values) for outliers
Available filters are:
Iterative processing, invalidating at each step the values "too far"
from the filtered values. The filtered_values method yields the final
filtered values.

Parameters
----------
clip
    CLip definition
nbr_iter
    Number of iterations.
    The effective number may be lower if no new outliers can be obtained.
filter
    Filter to apply.
threshold
    At each iteration, invalidate outliers = values where
    ``|values - filter(values)| > (std_coeff*std+const_coeff)*threshold``
    (then replace values by filter(values) for outliers).
    May be a numeric value or a clip.
std_coeff
    Coefficient attached to the standard deviation (std).
    May be a numeric value or a clip.
const_coeff
    Constant coefficient.
    May be a numeric value or a clip.
Example
from casys.editing import Clip, IterativeFilter
from casys.editing.filter import CompositeFilter, Median, Lanczos

condition = IterativeFilter(
    name="Iterative filter invalidation",
    clip=Clip("SIGMA0.ALTI"),
    nbr_iter=4,
    threshold=3,
    filter=CompositeFilter(
        filters=[
            Median(half_window_size=10),
            Lanczos(half_window_size=20),
        ],
    ),
)
StatisticsByPass
StatisticsByPass invalidates passes where mean or std
statistics exceed the thresholds.Invalidate passes where mean or std statistics exceed the thresholds.
Parameters
----------
clip
CLip definition
nbr_min_pts
Minimum number of points for a pass to be invalidated
threshold
Mean and std thresholds
orf
Orf description
Example
from casys.editing import Clip, StatisticsByPass

condition = StatisticsByPass(
    name="Statistic by pass invalidation",
    clip=Clip("sig0_ku"),
    nbr_min_pts=100,
    threshold={"mean": 13.7, "std": 4},
    orf=ad.orf,
)
Editing components
EditingComponent contains a list of invalidity
condition of the same type and the value of the invalidity indicator.tag the data with its value if invalidating it.An EditingComponent contains a list of invalidity conditions of the same
type and an invalidity indicator's value. Each component will tag the data
with its value if invalidating it.
Parameters
----------
name
Name of Component
invalidity_conditions
Conditions where the values will be considered as invalid
value
Invalidity indicator's value.
Example
from casys.editing import EditingComponent, ClipCondition, Clip, StatisticsByPass

e0 = EditingComponent(
    name="Invalid values",
    invalidity_conditions=[
        ClipCondition(
            name="Wind speed is NaN",
            clip=Clip("EQ_DV(WIND_SPEED.ALTI)"),
        ),
    ],
    value=1,
)

e1 = EditingComponent(
    name="Quality_indicator",
    invalidity_conditions=[
        ClipCondition(
            name="Sea ice",
            clip=Clip("IIF(FLAG_ICE.ALTI, IIF(FLAG_SURFACE_TYPE :< 2, 1, 0), 0) :!= 0"),
        ),
        ClipCondition(
            name="Land and enclosed seas except caspian",
            clip=Clip("IIF(FLAG_SURFACE_TYPE :== 0 || (FLAG_SURFACE_TYPE :== 1 && OCEANIC_BASIN_NUMBER :== 22), 0, 1) :!= 0"),
        ),
    ],
    value=2,
)

e2 = EditingComponent(
    name="Wind > 5",
    invalidity_conditions=[
        ClipCondition(
            name="Wind speed out of range",
            clip=Clip("WIND_SPEED.ALTI :> 5")
        )
    ],
    value=3,
)

e3_clip = ("IIF(BATHYMETRY.MODEL :< -1000 && DISTANCE_SHORELINE.MODEL.ABSOLUTE :> 100000 && OCEANIC_VARIABILITY :< 0.3,"
           "SEA_SURFACE_HEIGHT.ALTI.INTERP - SEA_STATE_BIAS.ALTI.NON_PARAMETRIC - SOLID_EARTH_TIDE_HEIGHT.MODEL.CARTWRIGHT_TAYLER_71"
           "- POLE_TIDE_HEIGHT.MODEL.WAHR_85 - DYNAMICAL_ATMOSPHERIC_CORRECTION.MODEL.MOG2D_HR - DRY_TROPOSPHERIC_CORRECTION.MODEL.ECMWF_GAUSS"
           "- OCEAN_TIDE_HEIGHT.MODEL.GOT4V8 - WET_TROPOSPHERIC_CORRECTION.RAD - IONOSPHERIC_CORRECTION.ALTI - MEAN_SEA_SURFACE.MODEL.CNESCLS11"
           "- SEA_LEVEL_ANOMALY_BIAS.ALTI, DV)")

e3 = EditingComponent(
    name="Per pass statistics",
    invalidity_conditions=[
        StatisticsByPass(
            name="e3_1",
            clip=Clip(e3_clip),
            nbr_min_pts=3,
            threshold={"mean": 0.3, "std": 0.4},
            orf=ad.orf),

        StatisticsByPass(
            name="e3_2",
            clip=Clip(e3_clip),
            nbr_min_pts=200,
            threshold={"mean": 0.15, "std": 0.2},
            orf=ad.orf)
    ],
    value=4
)
Diagnostic setting
EditingComponent and storing its results in
the user defined edt field.from casys import Field
edt = Field(name="EDITING.CUSTOM", description="My personal editing")
ad.add_editing(name="My editing", field=edt, components=[e0, e1, e2, e3])
ad.compute()
Diagnostic plotting
CasysPlot uses 2 parameters to determine what to
plot:
plot: plot’s type
plot= “time” (default): raw data diagnostics along time plots.
plot= “map”: raw data diagnostics map plots.
plot= “editing”: custom editing plot.
group: editing component name or list to include
group= “all” (default): Include all editing components
group= “valid”: Display unedited points
group= “xxx”: Name of the editing component to include
group= [“xxx”, “yyy”, …]: Name of the editing components to include
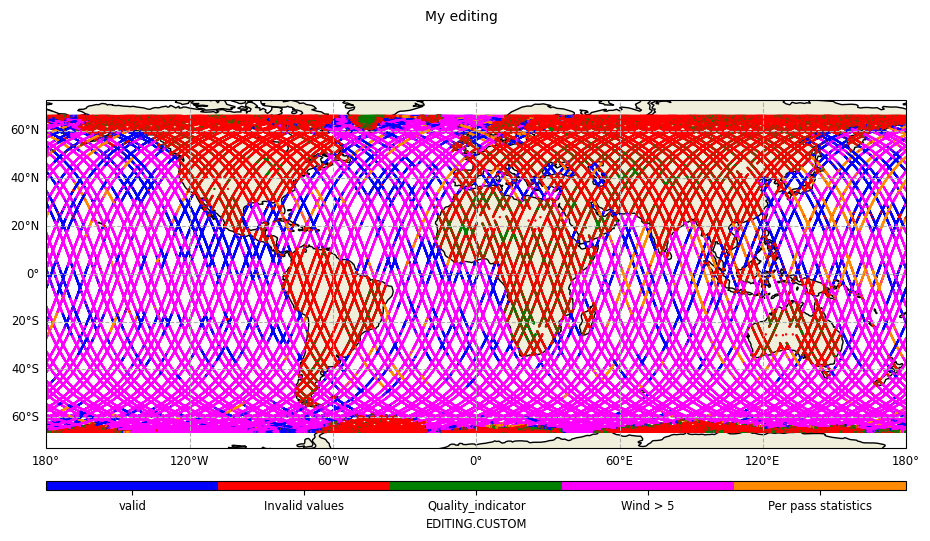
Map plot
Including all editing components
from casys import CasysPlot

plot = CasysPlot(data=ad, data_name="My editing", plot="map")

plot.show()
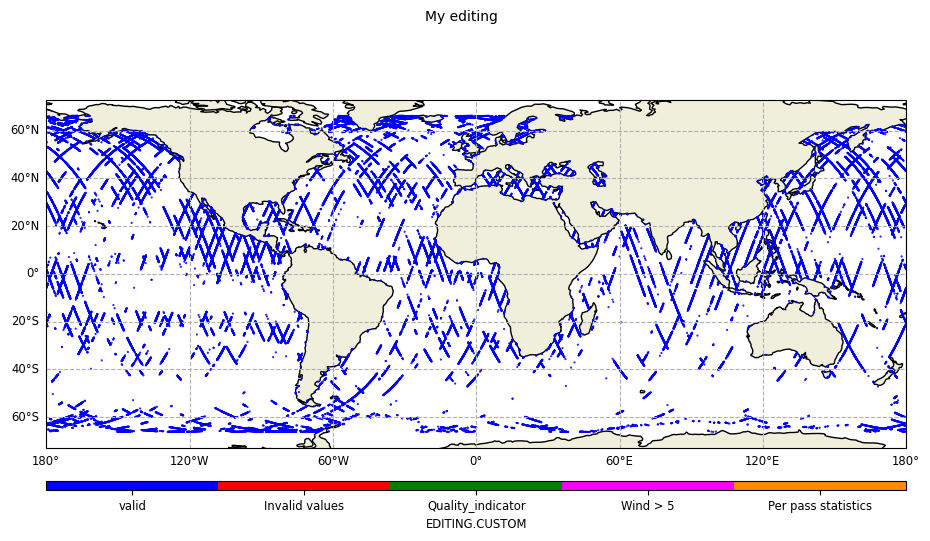
Limited to unedited data
plot = CasysPlot(
    data=ad,
    data_name="My editing",
    plot="map",
    group="valid",
)

plot.show()
Limited to values invalidated by the Quality_indicator and Per pass statistics components
plot = CasysPlot(
    data=ad,
    data_name="My editing",
    plot="map",
    group=["Quality_indicator", "Per pass statistics"],
)

plot.show()

Editing plot
Including all editing components
plot = CasysPlot(data=ad, data_name="My editing", plot="editing")

plot.show()

Limited to unedited data and Wind > 5 editing component
plot = CasysPlot(
    data=ad,
    data_name="My editing",
    plot="editing",
    group=["valid", "Wind > 5"],
)

plot.show()
