Periodogram diagnostics
Periodogram diagnostics are added using the
add_periodogram() method.A periodogram is computed from the result of a temporal diagnostic or sub-diagnostic
(from a crossover or missing points diagnostic).
Add the computation of a periodogram on the results of a temporal
diagnostic. This diagnostic must include the computation of the MEAN
statistic.

(nbr_periods, first_period, last_period) : basic use without 'ref_period'.
  0 < first_period < last_period

(nbr_periods, first_period, ref_period) : optimal 'last_period' calculated.
  0 < first_period < ref_period < last_period

(nbr_periods, ref_period, last_period) : optimal 'first_period' calculated.
  0 < first_period < ref_period < last_period

Parameters
----------
name
    Name of the periodogram statistic.
base_diag
    Name of the base temporal diagnostic.
stats
    Statistics result in the base_diag to compute the periodogram from.
    Default to the available statistics in the provided base diagnostic.
nbr_periods
    Number of periods.
first_period
    First period interval (to be used with 'last_period' or 'ref_period').
last_period
    Last period interval (to be used with 'first_period' or 'ref_period').
ref_period
    Reference period interval (to be used with 'first_period' or 'last_period').
diag_kwargs
    Dictionary containing the necessary information to identify a
    temporal sub diagnostics (similar to the get_data method ones).

    * Crossovers: "freq", the frequency of the sub-diagnostic to process.
    * Missing points:

      * "freq": the frequency of the sub-diagnostic to process,
      * "group": one of the missing points groups, defined in "mp_groups",
       the add_missing_points_stat method parameters (ex: "GLOBAL")
      * "dtype": "missing" or "available".
The
nbr_periods and a combination of two of the (first_period,
last_period, ref_period) parameters allow to determine the periods values
used to compute the periodogram (internally using the
PeriodsDefinition algorithm).The
stats parameter allows to choose for which statistical results to compute the
periodogram, among the available computed statistics of the base diagnostic.The default value is the list of statistics computed in the provided base diagnostic.
The
diag_kwargs parameter is used to select the correct temporal diagnostic in the
case of a periodogram computation from a crossover or missing points temporal
sub-diagnostic.For crossover’s diagnostics, the
freq parameter is required and associated
to one of the values provided to the temporal_stats_freq crossover’s parameter:diag_kwargs = {"freq": "1h"}
For missing points’ diagnostics, the following keywords are required:
freq: value among those provided to thetemporal_stats_freqparameter
dtype: the data type value among “missing”, “available” and “all”
group: “GLOBAL” or any of the groups defined with thegroup_gridparameter (“OCEAN” and “LAND” in the default casegroup_grid=True)
diag_kwargs = {"freq": "1h", "dtype": "missing", "group": "LAND"}
This kind of diagnostic is plotted as a curve.
Diagnostic setting
To compute a periodogram, we first need to set a temporal diagnostic or
sub-diagnostic.
In the following example we are setting a periodogram diagnostic, to be computed
from a previously defined temporal diagnostic.
import numpy as np

sig0 = ad.fields["SIGMA0.ALTI"]

ad.add_time_stat(
    name="Sigma 0 by hour",
    freq="1h",
    field=sig0,
    stats=["mean", "std", "var"],
)
ad.add_periodogram(
    name="Periodogram Sigma 0 by hour",
    base_diag="Sigma 0 by hour",
    stats=["mean", "std", "var"],
    nbr_periods=64,
    first_period=np.timedelta64(1, "D"),
    last_period=np.timedelta64(10, "D"),
)

ad.compute()
Others cases from temporal sub-diagnostics will be detailed
here.
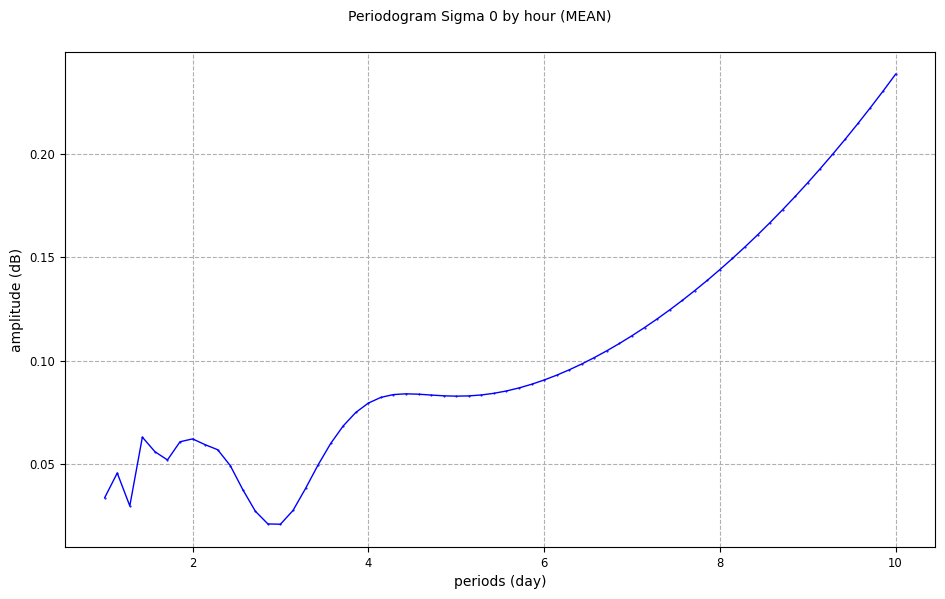
Diagnostic plotting
Periodogram diagnostics are plotted as curve. A
stat parameter must be provided
when creating a CasysPlot.from casys import CasysPlot
plot = CasysPlot(data=ad, data_name="Periodogram Sigma 0 by hour", stat="mean")
plot.show()
Diagnostic data
Periodogram data can be accessed with the
get_data() method.A
stat parameter needs to be provided to the method.ad.get_data(name="Periodogram Sigma 0 by hour", stat="mean")
<xarray.Dataset> Size: 1kB
Dimensions:                   (periods: 64)
Coordinates:
  * periods                   (periods) float64 512B 1.0 1.143 ... 9.857 10.0
Data variables:
    amplitude_1h_SIGMA0.ALTI  (periods) float64 512B 0.03379 0.04568 ... 0.2384