Geographical box diagnostics
Geographical box diagnostics are added using the
add_geobox_stat() method.Requested statistics will be computed for the provided field in each box defined by
the
res_lon and res_lat parameters.Add a geographical box diagnostics computing requested statistics
for the provided field in each box defined by the res_lon and res_lat
parameters.
Geobox stat data and plots can be accessed or created using special keywords:
* plot="box" (default): color mesh representation, on an x-axis/y-axis grid.
* plot="3d": 3d color mesh representation, on an x-axis/y-axis/z-axis 3d grid.
Parameters
----------
name
Name of the diagnostic.
field
Field on which to compute.
stats
List of statistics to compute (count, max, mean, median, min, std, var,
mad).
res_lon
Minimum, maximum and box size over the longitude (Default: -180, 180, 4).
res_lat
Minimum, maximum and box size over the latitude (Default: -90, 90, 4).
projection
Projection in which to project longitude and latitude values before binning
data.
box_selection
Field used as selection for computation of the ``count`` statistic.
Box in which the box_selection field does not contain any data will be set
to NaN instead of 0.
stat_selection
Selection clip used to invalidate (set to NaN) some bins.
Valid conditions are:
* count
* min
* max
* mean
* median
* std
* var
* mad
These clips are Python vector clips.
Examples:
* count :>= 10 && max :< 100
* min :> 3
* median :> 10 && mean :> 9
This kind of diagnostic is plotted as as pseudo-color map plots with a non-regular
rectangular grid.
Diagnostic setting
In the following example we are setting a box diagnostic computing 3 statistics
(mean, standard deviation and variance) at a daily frequency for a user defined
SLA
field.Box are defined as 2° longitude x 2° latitude over the entire surface of the globe.
from casys import Field

sla = Field(
    name="SLA",
    source="ORBIT.ALTI - RANGE.ALTI - MEAN_SEA_SURFACE.MODEL.CNESCLS15",
    unit="m",
)

ad.add_geobox_stat(
    name="SLA box stat",
    field=sla,
    stats=["count", "median", "std"],
    res_lon=(-180, 180, 2),
    res_lat=(-90, 90, 2),
)

ad.compute()
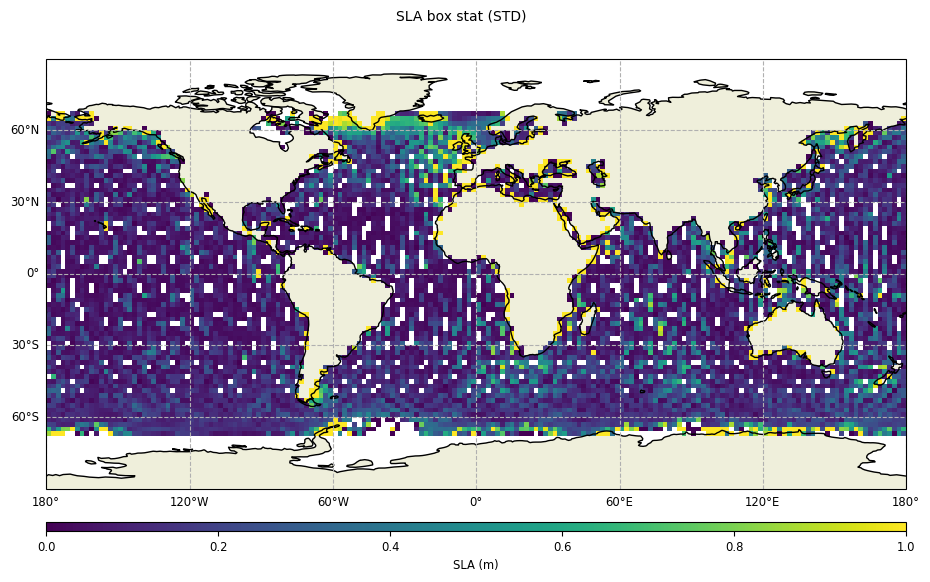
Diagnostic plotting
Standard 2D plot
Geographical box diagnostics can be plotted as pseudo-color map plots with a
non-regular rectangular grid by using the default plot parameter value box.
CasysPlot requires a stat parameter to
be given in order to know which statistic to display.from casys import CasysPlot, PlotParams
plot = CasysPlot(
data=ad,
data_name="SLA box stat",
stat="std",
plot_params=PlotParams(color_limits=(0, 1)),
plot="box",
)
plot.show()
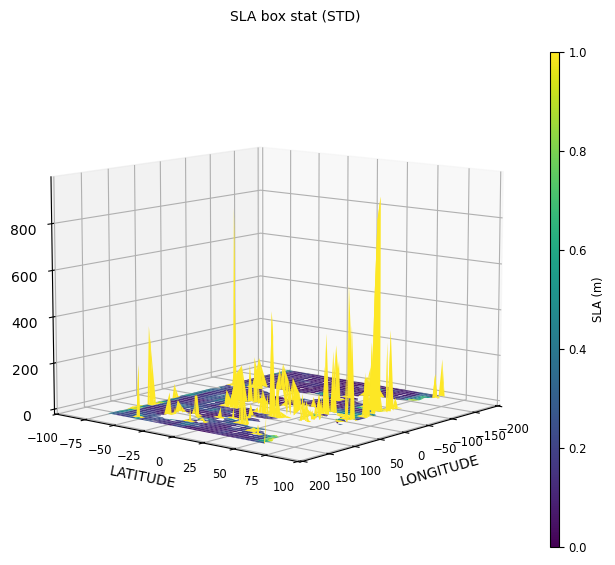
3D plot
Geographical box diagnostics can be plotted as 3d surface plots with a
non-regular rectangular grid, with the *plot parameter value 3D.
CasysPlot requires a stat parameter to
be given in order to know which statistic to display.plot = CasysPlot(
data=ad,
data_name="SLA box stat",
stat="std",
plot_params=PlotParams(color_limits=(0, 1)),
plot="3d",
)
plot.show()