


Chronology of the events
Particularly strong "El Niño" events were observed in 1982-1983 and 1987-1988. In December 1993, the Topex/Poseidon measurements evidenced a positive anomaly of around 8 centimeters in the sea surface dynamic topography associated with eastward propagation. Since this date, altimetric satellites have closely monitored the oceans and recorded the slightest variations in sea level.
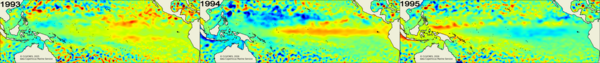
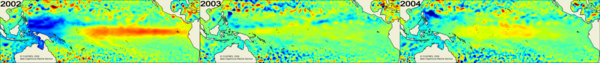
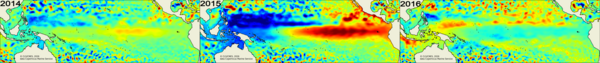

Monthly averages maps (in cm) on Novembers each year since 1993, over the Equatorial Pacific from the El Niño Bulletin. The time series of the standardized Sea Level Anomalies is also displayed and updated on the Indicator page. Credits CLS/CNES
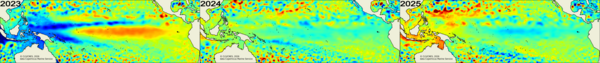
2023
El Niño's back, but with a moderate amplitude
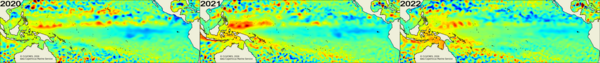
2020; 2021 and 2022
A moderate La Niña occured on those three years.
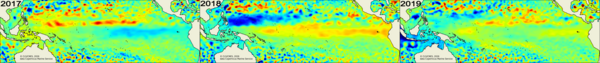
2018
A weak El Niño showed up.
2015
An El Niño is announced early in May 2015, possibly a strong one. Maps of Sea Level Anomalies show large areas across the equatorial Pacific with above average. Sea Surface Temperature are also above-average on May 2015 and strengthenes across the east-central Pacific during summer. Those conditions are as high as observed during 1987 El-Niño, and thus forecasts are close to that episode. By keeping in mind, the last years when El Niño aborted, the 2015 event is examined in detail and particularly the atmospheric features. During July easterly winds are weaker than normal. The ocean-atmosphere coupling is in place. See Image of the month July 2015 "El Niño's return, west side story".
2014
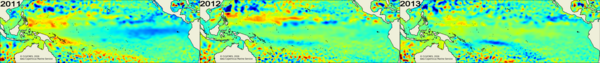
In February - March 2014 and up to May 2014, an El Niño was announced, possibly a strong one. Sea Surface Temperature was high all over Tropical Pacific with borderline conditions but with few or no temperature gradient. So El Niño aborted early in June because a lack of winds: no winds, no "southern oscillation", and El Niño disappeared. See Image of the month January 2015 "El Niño played hide and seek in 2014".
2012
Sea Surface Temperatures are above normal average over the Pacific ocean but no clear ocean-atmosphere coupling started leaving neutral conditions.
2010
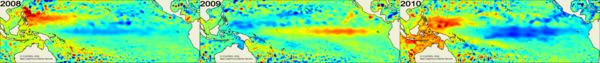
La Niña is back: since the beginning of summer, Sea Level Anomalies are definitely lower near South America, and high around Indonesia. La Niña strengthened during August 2010. See August 2009-2010 animation and the Image of the month, January 2011: "La Niña's in turn to wreak havoc".
2009-2010
In early summer 2009, forecast models predict a moderate El Niño event for the autumn (See Lively Data; 2009/07/17: Prelude to El Niño early in summer 2009). Sea surface height positive anomalies are measured from August 2009 with a maximum during December 2009. This event is characterized by a moderate strength, and is localized around the Central Pacific rather than along the American coasts as the typical El Niño event. For these reasons, this episode is known as El Niño "Modoki" (meaning "similar but different" in Japanese). These conditions should weaken to normal conditions during the first half of 2010. See Image of the month, November 2009: If it's not El Niño, then it must be his brother... and view the August 2009 - February 2010 animation 3.3 MB).
2007-2008
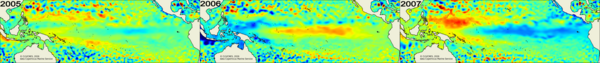
A La Niña episode is occuring in the Equatorial Pacific since the beginning of 2007. After an interruption in March-May 2007, this event continues during this early winter 2007-2008 and is expected to continue until spring 2008. El Niño region indices are cooler than -1.5°C. See Lively Data, January 23, 2008 : La Niña, westerly current.
2006-2007
In early 2006, after strong westerly winds, sea surface temperature positive anomalies are measured in the central equatorial Pacific. These high temperature anomalies gradually invaded the whole equatorial basin, characterizing a new El Niño event.
The strongest moment of this event occured in December 2006 when these anomalies did not exceed 1.5 ° C in eastern basin. The warming of 2006 is the 3rd of a series of 3 events with low amplitude, separated by a period of 2 years (2002, 2004 et 2006). Image of the month, January 2007 : El Niño on time for Christmas.
2004-2005
In 2004 again, a moderate El Niño occured followed by a La Niña event (Lively Data, October 18, 2004 : An El Niño this year? and February 17, 2006: La Niña in sight.
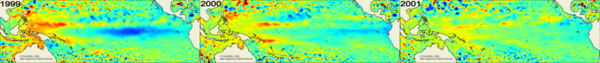
2002-2003
After some forewarning signs in January and February 2002, followed by a respite, El Niño really started at the end of May-beginning of June. Alert was given, and its amplitude estimated "weak to moderate" in July, more like "moderate" since September. (Image of the month, November 2002 : El Niño under close scrutinies, Lively Data, July 21, 2003 : Tracking El Niño).
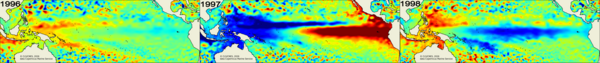
1997-1998
Early in March 1997, one of the most pronounced warm episodes of the last 50 years occured. In autumn 1997, sea level anomalies reached over 20 cm at the eastern end of the basin, along with surface temperature anomalies above 4°C, while large negative anomalies at the western end reflected a flattening of the thermocline slope across the tropical basin.
These anomalies produced La Niña conditions beginning in autumn 1998 and persisting through 1999 (See Image of the month, November 1998, From El Niño to La Niña ?). In 2000, ocean once more returned to normal. Further information on The El Niño 1997-1998 of the century ?
1995-1996
Cold La Niña conditions were observed from the end of 1995 to November-December 1996.
1993-1994
Conditions were almost normal again by the end of 1993, followed by a third warming in 1994 whose build-up was monitored by Topex/Poseidon (with a sea level rise of about fifteen centimeters in the eastern Pacific).
1991-1992
The satellite has continuously tracked related ocean-climate changes in the Pacific Ocean, such as warm El Niño and cold La Niña episodes: El Niño 1991-1992, El Niño 1994-1995, La Niña 1995-1996 and El Niño 1997-1998. After the 1991 El Niño, conditions returned to normal the following year. However, a number of westerly gales during the autumn and winter of 1992 affected the upper layers of the ocean, leading to a second moderate warming across the Pacific basin.
Further information :
Applications
 Ocean .
- Coastal ocean applications .
- Ice and Cryosphere .
- Climate .
- El Niño Southern Oscillation - ENSO .
- More information about ENSO (El Niño and La Niña).
- Chronology of El Niño and La Niña events.
- NAO .
- Decadal oscillations.
- Indian Ocean Dipole (IOD).
- Seasons.
- Global mean sea level budget.
- Atmosphere, wind and waves .
- Geodesy and geophysics .
- Biology .
- Navigation by area .