


High waters in Mississipi river
Altimetry enable to monitor river levels. Current flooding over the Midwestern US can be seen with the hydrology-dedicated data.
Severe annual spring floods affected the Midwestern United States beginning late February 2011 and it is expected that the river level will continue to remain above flood stage over numerous locations along the Mississipi river.
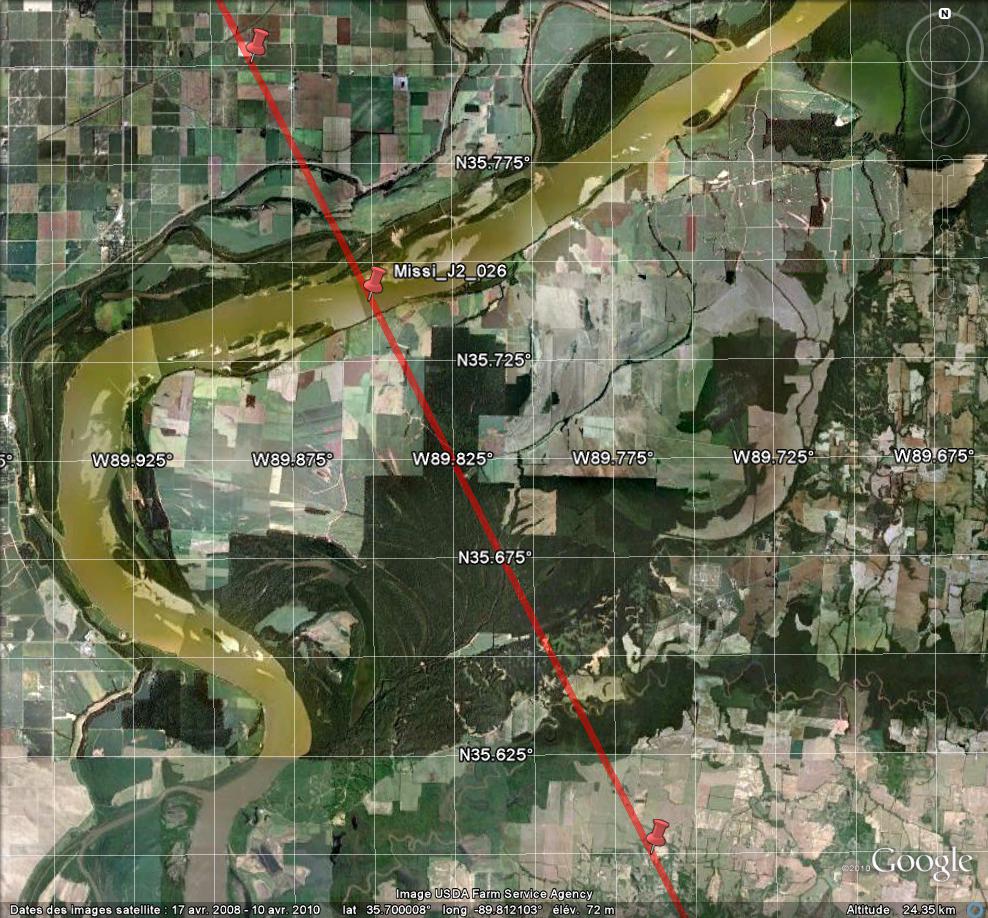
The Pistach products dedicated to coastal and hydrology studies enable to monitor the water level over rivers. Near the Osceala city, Arkansas, the Jason-2 ground track #026, between the Jason-2 cycles 095 to 105 (respectively 2011/01/31 to 2011/05/10), highlights a level rise up to 10 m.
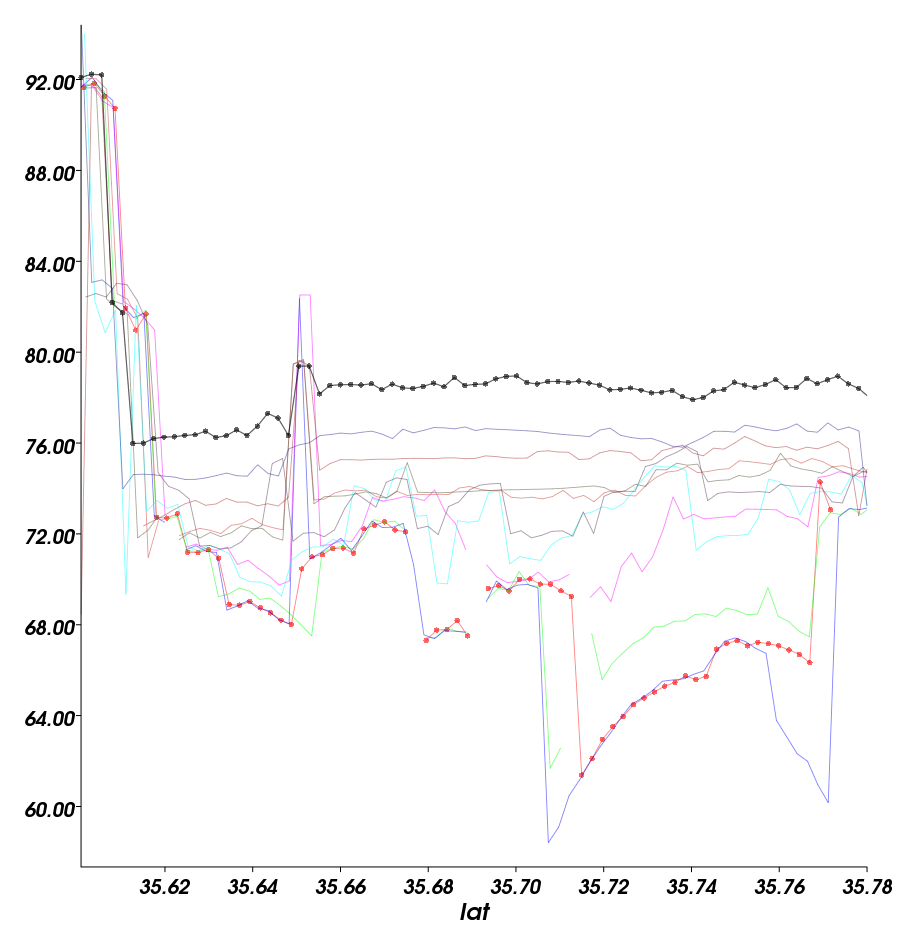
The plot below gives a water level per 10-day cycle vs latitude, along the #026 ground track . The oldest cycle plotted here (Jason-2 cycle 095 - 2011/01/31) is drawing with points in red. The newest cycle (cycle 105 - 2011/05/10) is drawing with points in black. During 3 months, the water level regularly rises on the Hatchie river (south of the area, near latitude=35.64°N) and the Mississipi river (north of the area, near latitude=35.74°N). These two rivers are separated by a little hill cultivated with cotton fields (see the name "relief on the plot, near latitude=35.65°N) which is sometimes "detected" by the altimeter. For the oldest cycles (cycle 095 to 098), the rivers seem to be contained in their riverbed. From the cycle 099 (2011/03/11), it seems that the river spread out beyond their riverbed. In this area, in early May, the Mississipi river streches over a 10 km wide band.
 |  |
|---|---|
Altimetry-derived heights over the Hatchie and the Mississipi rivers along the Jason-2 #026 ground track, every ten days between January and May 2011, ie between cycle 095 (2011/01/31) and cycle 105 (2011/05/10). Each curve represents the water level in meters (Y-axis) along the ground track (X-axis represents the latitude) at a given cycle so each curve is spacen from 10 days. Jason-2 data are processed for hydrology applications. Credits CLS/Cnes. | |
Further information:
- Data: Coastal and hydrological products.
- Applications: Hydrology
- Earth Observatory website: Floods continue along the Mississipi river (2011/05/08) with MODIS images near the Osceala city.
- Hydroweb website: water level time-series over the Mississipi river (see the area name "026_1" near the Osceala city).