Observing the ocean to improve forecasting
Image of the Month - March 1999
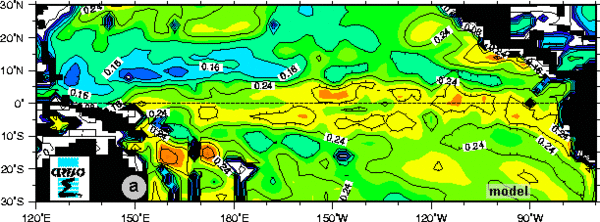
Modeling a phenomenon involves identifying its main characteristics and expressing them mathematically to better understand and, above all, predict how the phenomenon is likely to evolve. The law of gravity governing free-falling bodies is a simple example of a model: the equation x = ½gt² allows us to predict the fall of a body with a high degree of precision, provided its location is known at a given time.
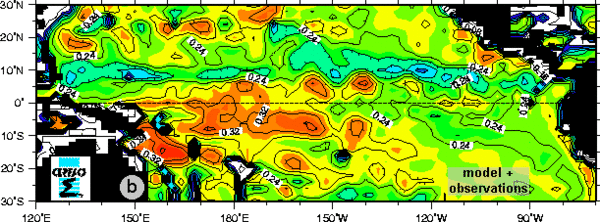
Data assimilation, i.e. entering observation data in models as a starting point or reference, is the most effective way of achieving reliable results. Assimilation of ocean data in a climate prediction model enables us to forecast climate several months ahead. This in turn should make it possible to use a coupled ocean/atmosphere model to forecast mean sea temperature for a particular month with a high degree of confidence in certain regions of the world (for example, in tropical zones affected by El Niño events). Data assimilation also lets us reanalyze existing data, in the light of more recent observation data.
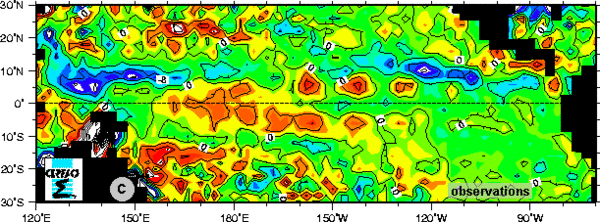
Altimetry data, which provide highly accurate global coverage of the oceans, are very useful in this respect. The example shown here concerns the tropical Pacific, but the same model-the OPA general ocean circulation model-has been applied on a global scale. The results will be used to evaluate the accuracy of predictions made by the coupled OPA/Arpege model, developed by Cerfacs, the European Center for Research and Advanced Training in Scientific Computation, by comparing them with data acquired in 1993-97.
See also:
- Applications: El Niño - Southern Oscillation
- Applications: Operational applications
Websites on this subject:
- Climate forecasting
Global Change and Climate Modelling (Cerfacs)
European Centre for Medium-range Weather Forecasting
Climate Prediction Center (Noaa) - El Niño Forecast
TAO
