


Monitoring an iceberg topography with altimetry
Image of the Month - October 2019
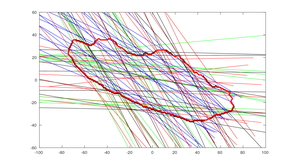
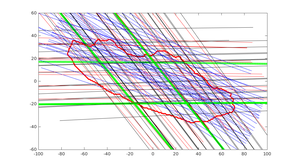
Altimeter ground tracks over A68 (red: Saral, black: HY-2A, green: S3-A land data, blue: Cryosat (Interferometric mode)), left before the calving and another during the first 6 month of its drift (July 2017 to Jan. 2018). The topography is estimated by either merging (weighted mean) of the 4 individual fields or by interpolation/griding all altimeter samples.
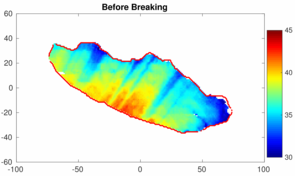
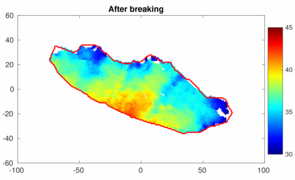
Two altimeter topographies of A68 have been computed, left before the calving and another during the first 6 month of its drift (July 2017 to Jan. 2018). Their comparison shows no melting during this period.
Note that the iceberg has rotated and slightly moved Northwards between the left and right maps (Credits Ifremer)
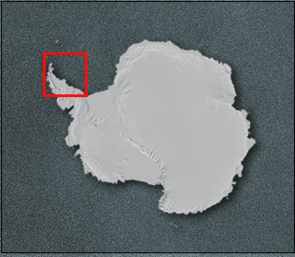
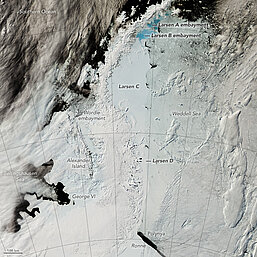
The Antarctic Peninsula ice shelves, by the Weddell Sea, are closely monitored especially after the collapse of the "Larsen A" and then "Larsen B" platforms (the latter around 2002). Giant icebergs are now calving from the Larsen C platform, under the watchful eye of satellites -- the only feasible way of monitoring this every days of the year. In August 2016, cracks appeared on the Larsen-C ice shelf. By July 2017, a giant iceberg, called A-68, was completely detached from the shelf. During the following year it rotated 180° counterclockwise and drifted northwards, and then continued rotating and drifting. A68 is the third largest iceberg on record with an area of 5,800 km2. At the time of its calving, it was 175-km long and 50-km wide.
Satellite Radar altimetry can measure ice topography, over continental and sea ice but also over such huge piece of ice detached from the continent. It has the advantage of being able to measure through cloud, and also by night. At these latitudes, revisit time and grounds tracks are quite close, moreover, leading to a very high density of altimeter data over the iceberg.
The A68 topography could be estimated from altimeter data at regular time interval to compute the iceberg melting by difference from the initial state. It can also be validated and calibrated against other elevation data sets such as the GLAS/ICESat Antarctic Digital Elevation Model from laser altimeter data and the Reference Elevation Model of Antarctica (REMA) constructed from stereoscopic satellite imagery (both sensitive to cloud cover, and the latter only by daylight). Synthetic Aperture Radar imagery enable to locate the iceberg and take into account its moves (rotations and shifts).
This study shows that it is possible to construct a complete 1-km resolution topography every 6 month from SAR images (for location) and altimeter (for topography) allowing for a precise study of melting and fragmentation. Future development should use Cryosat SARin data, which are giving more details. The Cristal polar-dedicated satellite mission currently proposed should have an interferometric altimetry such as Cryosat's one onboard.
See also:
- Applications: Ice and cryosphere
- Image of the Month, August 2000: A lake capped by ice
- Image of the Month, September 2013: Icebergs on the move
- Image of the Month, November 2008: Counting icebergs
- User corner: Altimetry & glaciology workshops (mostly in French)
Other website on this subject:
- A database of iceberg trackings is available throught Ifremer's Cersat center, at ftp://ftp.ifremer.fr/ifremer/cersat/products/gridded/altiberg/
- Antarctica’s Changing Larsen Ice Shelf, Nasa EarthOBservatory
References:
- Jean Tournadre, 2018: Topography of A68 Iceberg from Altika and Cryosat Data, 25 Years of Progress in Radar Altimetry Symposia, Ponta Delgada, Sept. 2018.
News
 Archives .
- Aviso Newsletter .
- Search.
- Front-page news.
- Image of the month .
- 2026 .
- 2025 .
- 2024 .
- 2023 .
- 2022 .
- 2021 .
- 2020 .
- 2019 .
- Dec. 2019: Mean dynamic topography.
- Nov. 2019: 2019 monsoon monitored using altimetry .
- Oct. 2019: Monitoring an iceberg topography with altimetry.
- Sep. 2019: Internal tides in the Solomon Sea change with ENSO phases.
- Aug. 2019: Fifty years ago....
- Jul. 2019: Increasing wave power.
- Jun. 2019: Modelling the flow.
- May 2019: Liguro-Provençal current seen by in situ instruments and altimetry.
- April 2019: Pantanal wetlands.
- Mar. 2019: Focusing on small water bodies.
- Feb. 2019: Sharks in eddies and meanders.
- Jan. 2019: From La Niña to El Niño, Aviso Image of the Month 20th birthday!.
- 2018 .
- 2017 .
- 2016 .
- 2015 .
- 2014 .
- 2013 .
- 2012 .
- 2011 .
- 2010 .
- 2009 .
- 2008 .
- 2007 .
- 2006 .
- 2005 .
- 2004 .
- 2003 .
- 2002 .
- 2001 .
- 2000 .
- 1999 .
- 1998 .
- Operational news and status .