


Thirteen eventful years
According to Michel Lefebvre, one of the main players, the story began at the Williamstown Conference in 1969, when for the first time satellite altimetry was considered as an interesting and technically feasible prospect. It could be argued that the very first time was actually much earlier: when man first went to sea on a boat and tried to understand the ocean it was floating on (to avoid sinking and get to his destination as quickly as possible); or in 1777 when Benjamin Franklin mapped the Gulf Stream on a marine chart; or even with HMS Challenger and the first oceanographic measurement campaign; or in 1957 with the first International Geophysical Year which coincided with the launching of Sputnik; or much later, in the 1970s with Skylab and Geos3 - the first satellites to carry altimeters; or lastly in 1978 with Seasat, the first satellite to provide usable - and useful - data.
At all events, in 1981 Cnes was evaluating Poseidon, an altimeter which was to be carried on the first SPOT satellite. At the same time, Nasa, which wanted to further the achievement - albeit brief - of Seasat, was planning the Topex (Topography Experiment) mission. However, neither agency had the budget to carry out this kind of mission alone. In 1983, they began discussing the possibility of combining their two projects.
In 1987, Cnes and Nasa formally created a partnership for a joint project involving French and American instruments, on an American satellite to be launched by a European rocket (Ariane 4): this was to become Topex/Poseidon.
1992: the launch
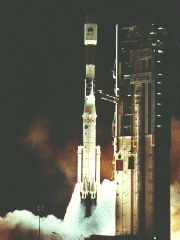
Topex/Poseidon was launched from Kourou on 10 August. This was a successful outcome for all the work involved in designing the instruments, building and testing the satellite and programming the software (used to convert the signal sent by the satellite into time-tagged data with a precise location and corrected for environmental distortions, in order to transform a radar pulse echo into a 'sea surface height' measurement). 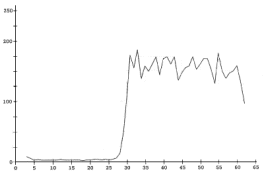
The first altimetry measurements from Topex/Poseidon actually came from the prototype Poseidon-1 instrument, on 21 August 1992, as it was difficult to program the main Topex instrument until the satellite reached its permanent orbit.
1993
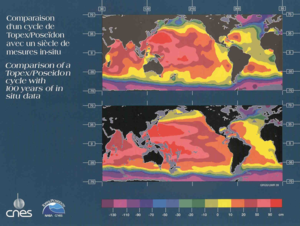
The first data were distributed to the teams working on the project and the first images (the 'Quick-look' series) were calculated, plotted and published. When we compare these images with those made using a set of measurements made at sea over the last hundred years, they not only correspond, but also provide greater detail with only ten days of satellite measurements!
1994
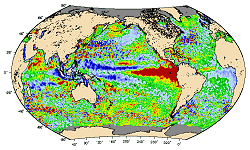
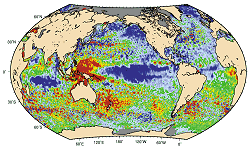
This year saw Topex/Poseidon's first 'El Niño'. This was expected, as Geosat had already observed the 1987 event (although its data were classified at the time). This time, we were able to monitor the phenomenon as it progressed over time.
The first Aviso 'value-added' data were produced, calculated from basic geophysical data; these were more user-friendly. Altimetry data started becoming available to a wider range of users: the scientists receiving Aviso altimetry data grew from 35 members of the scientific group to members of more than 100 research teams (there are around 700 today).
Aviso launched its own website (the 'ancestor' of the one you use today), in order to supply more information to the users of its data.
1995
This year was a turning point. On the one hand, Topex/Poseidon had (already) reached the end of its nominal three-year lifespan (which would ultimately be surpassed by ten years!) and its first scientific results were published. On the other hand, the Mercator operational oceanography project was being planned and this would need altimetry measurements as the input for its high-quality forecasts.
1996
ERS-2, which was launched the previous year, began yielding its first data. Together with this and other data from ERS-1, Aviso initiated a 'multi-mission' project which involved combining data from several inter-calibrated satellites (with the Topex/Poseidon oceanography mission as a reference). This enabled finer details of ocean circulation to be obtained, particularly eddies.
The first detailed reprocessing of Topex/Poseidon data began. The improvements that were achieved, due largely to the efforts of the Science Working Team (SWT), led to the error budget being reduced and a precision of two to three centimeters being announced (compared with 13 cm prior to the launch). Needless to say, this improvement had been anticipated by the designers. It was the equivalent of measuring a football field to the nearest micron.
1997
This was the year of the El Niño: the strongest and most prolonged El Niño event of the 20th century. From an altimetry perspective, it was monitored almost in real time by Topex/Poseidon from its inception through to its transition to the La Niña phase at the end of 1999. This was in fact the year in which the near-real-time Topex/Poseidon data were routinely published (within 48 hours after measurement). Rapidly-delivered data are essential for operational oceanography.
1998
Apart from tracking 'the El Niño of the century', this year saw the very first Aviso gridded data, which were an immediate success for two reasons: their distribution in the form of a regularly-spaced grid; also the fact that they were 'multi-mission' - combining measurements from several different satellites (which are currently published as part of the Ssalto/Duacs range).
GFO (Geosat Follow-on) is launched in February by US Navy.
Moreover, in this 'Year of the Ocean', the Godae (Global Ocean Data Assimilation Experiment), international operational oceanography program was launched, with the aim of demonstrating the possibility of setting-up a truly integrated system for observing and forecasting the ocean and for maintaining such a system over the long term.
1999
'The El Niño of the century', which had slowly been evolving during 1998, reached its La Niña phase in 1999.
On the satellite, this year's main event was the switch-over to the Topex-B backup instrument, in order to correct a drift in the Topex-A instrument. Having two equivalent instruments, which could be activated from the ground control centers, contributed to a much longer life span, as any problems, or the failure of a single instrument, would not jeopardize the entire mission.
2000
The Jason-1 calibration and validation (Calval) plan was set up. Topex/Poseidon played a significant part, as for more than six months, the two satellites were to follow each other (one minute apart), thus measuring practically the same thing.
On the operational oceanography scene, <lk>Godae</lk> began its component development and testing phase.
2001
This was a lucky year, starting with the inaugural bulletin of the Mercator project (for the North and Tropical Atlantic at a resolution of 1/3° ) published on the 17 January.
On 7 December the eagerly-awaited Jason-1, the follow-up to Topex/Poseidon, was launched to ensure mission continuity. This marked the beginning of 'operational' altimetry, with data available three hours (for Operational Sensor Data Records - OSDR) and two days (for Interim Geophysical Data Records - IGDR) following acquisition.

2002
From mid-August onwards, during its tenth year, Topex/Poseidon was gradually transferred to a new orbit, a maneuver which was completed in mid-September. The new ground track of the orbit was halfway between its old tracks (henceforth those of Jason-1). This tandem phase enabled measurements to be provided from two inter-calibrated, precise altimeters working together on similar orbits 158 km apart at the Equator.
On March 1st Envisat Earth observing satellite is launched. Onboard, among the ten instruments, an altimeter.
An aborted El Niño phenomenon was observed in 2002. Models forecasted a 'moderate' phenomenon, which in fact disappeared completely before reaching the South American coast. This kind of unexpected event highlighted the importance of long-term observations in order to better understand such phenomena and their variations, so as to model them correctly.
2003
This was a year of increasing interactivity, with the opening of the Live Access Server (LAS) and the Aviso Opendap server, enabling users to plot maps and graphs and retrieve data interactively. Data from Topex/Poseidon, as well as combined data from several satellites, could thus be accessed.
In addition, the demonstration phase of Godae began with the different centers jointly supplying data products to the user community.
2004
By calculating a precise mean dynamic topography using a combination of altimetry, in situ and Grace satellite data, it became possible to determine the total current, rather than just its variations . The along-track ADT (Absolute Dynamic Topography) and gridded MADT (Maps of ADT) products, henceforth distributed by Aviso, made this view of ocean dynamics possible.
2005
Topex/Poseidon's end began on October 9, when its pitch reaction wheel, which helps keep the spacecraft in its proper orbital orientation, stalled. Subsequent analysis by NASA and French Space Agency ground controllers concluded the wheel was no longer functional.
However, the life of its data continues, with Jason-1, Topex/Poseidon and Envisat reprocessing, in order to have the longuest best-quality dataset. Those reprocessing include the latest standards in term of models and corrections.
On October 14, Mercator Ocean presented its first global bulletin at 1/4°, a bulletin that describe currents, temperature and salinity over all the world's oceans, from surface to bottom up to 14 days ahead of time.
Missions
- Timeline Altimetry.
 Past missions .
- Geosat.
- ERS-1 .
- Topex/Poseidon .
- Instruments .
- Orbits.
- Objectives.
- Mission performances.
- Thirteen eventful years.
- ERS-2 .
- GFO.
- Jason-1 .
- Envisat .
- Jason-2 .
- HY-2A .
- Spot.
- Current missions .
- Future missions .