Climate prediction systems cut their teeth on El Niño
Image of the Month - December 2000

El Niño is a major climatic event affecting not only the tropical Pacific Ocean but many other regions from South Africa to North America. If they are to be effective, seasonal climate predictions systems must therefore be able to predict an El Niño above all else.
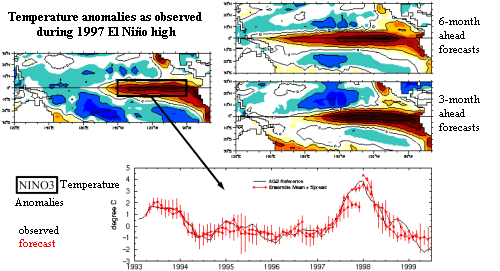
The figure here shows the results of experimental predictions (hindcasts) of the 1997 El Niño, the biggest such episode in recent decades. These experiments used a coupled ocean-atmosphere model with inputs every three months of atmospheric observations and of sea state derived from Topex/Poseidon altimetry data.
The predictions cover a period of six months. Since some uncertainties always remain, several predictions are performed from the same date to explore how climate is likely to evolve and to build probable scenarios. In this case nine predictions were generated for each date every three months, yielding the "error bars" shown on the curve. Seasonal prediction requires a lot of processing power as the models are very compute-intensive, and we need to simulate several hundred years using inputs from many different cases to judge how the prediction system will perform.
Nevertheless, the results shown here clearly indicate that this system could have predicted the build-up of the 1997 episode and the subsequent cold La Niña episode the following year. They also confirm that the further we look ahead the less accurate predictions are-for example, the prediction of the 1997 peak six months ahead of time is not quite right.
The system presented here is still in its experimental stages and does not yet deliver real predictions. However, some centers are already producing monthly or three-monthly predictions. After the major warm event in 1997, cold La Niña conditions persisted for about two years in the tropical Pacific before returning to "normal" in 2000. For 2001, climate prediction centers are not expecting another El Niño but rather a slight and gradual warming of the Pacific Ocean.
See also:
- Applications: El Niño
Websites on this subject:
- Prediction Center
- European Centre for Medium-Range Weather Forecasts (ECMWF)
- Climate Prediction Center (CPC, NCEP/Noaa)
- International Research Institute for climate prediction (IRI) - Trpopical Pacific real-time observation
- TAO


