


El Niño and TOPEX/POSEIDON
T. Busalacchi (GSFC, USA), M. McPhaden (PMEL, USA) and J. Picaut (ORSTOM, New Caledonia)
In view of the very high accuracy of TOPEX/POSEIDON and a mission design life of five years, a cautious optimism and anticipation existed prior to launch that the TOPEX/POSEIDON mission would also be able to monitor the evolution of a complete El Niño cycle. The timing of the launch of TOPEX/POSEIDON in August, 1992 was somewhat fortuitous since it occurred in the middle of the extended 1991-1992-1993 El Niño.
Although this meant that the entire development (i.e., initiation, mature phase, and decay) of this particular El Niño episode would not be captured, it did mean that significant sea level variability should be present across the entire equatorial Pacific basin during the initial verification phase of the mission. This variability was observed from in-situ measurements provided by the Tropical Ocean-Global Atmosphere (TOGA) Tropical Atmosphere Ocean (TAO) observing system. TOGA-TAO was designed to provide continuous, high quality measurements in the equatorial Pacific wave guide for improved description, understanding and prediction of short-term climate variability. The deployment of approximately 60 TAO surface moorings in the equatorial Pacific thus permits monitoring dynamic height variability, among other quantities, on a real-time basis across the full width of the equatorial Pacific basin. Together with the TOGA Expendable BathyThermograph (XBT) Network and the TOGA Surface Velocity Drifter Network, no other portion of the world ocean is as densely instrumented and routinely monitored as the equatorial Pacific Ocean. The TOPEX altimeter data to be used here is an enhanced Geophysical Data Record (GDR) produced by the Goddard ocean altimetry group (courtesy of C. Koblinsky). The tidal corrections applied are those of Schrama and Ray [1994]. The first 51 10-day cycles are considered here (26 September 1992 to 13 February 1994).
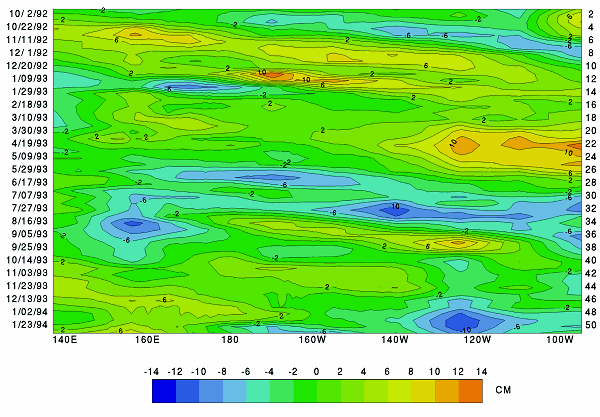
Ten-day fields of sea level anomalies relative to the mean over the first 506 days have been created by optimally interpolating the collinear data onto a 1° x 1° grid using decorrelation scales of 15° zonally and 3° meridionally. The in situ data used in this study are from the multi-nationally supported TOGA Tropical Atmosphere Ocean (TAO) Array of ATLAS (Autonomous Temperature Line Acquisition System) and PROTEUS (Profile Telemetry of Upper Ocean Currents) moorings.
The space-time structure of the surface topography will be examined for both the TOPEX and TOGA-TAO data sets within about 8° of the equator. We wish to determine if the large-scale signals depicted by TOPEX during the first 506 days of the mission are consistent with those observed by the in situ TOGA-TAO network. Since the TAO Array was designed in part to observe the excitation and propagation of equatorial wave activity in the tropical Pacific Ocean, particular attention will be given to the description of wave variability in the TOPEX data. Figures 1 and 2 depict the time-longitude structure of the equatorial sea surface topography variability relative to the 506-day mean in both the TOPEX and TAO data sets. Similar eastward propagating features are present in both the TOPEX (Figure 1) and TAO (Figure 2) data. The amplitude of the variability is similar in both data sets with TOPEX indicating more small scale structure. This may be indicative of the fact that the TOPEX data have a greater spatial resolution than the TAO array. The phase lines in these time-longitude analyses imply eastward propagation speeds of (2.49 ± 0.22 ms-1) for TOPEX and (2.16 ± 0.43 ms-1) for TAO, which are consistent with the expected phase speeds of low-order baroclinic mode, equatorially trapped Kelvin waves.
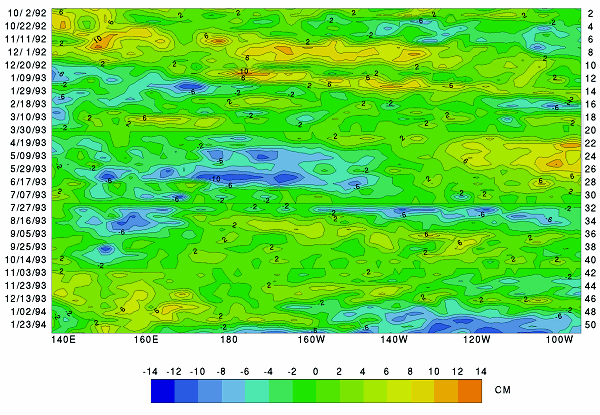
In response to the easterly wind anomalies east of 170°E in October, 1992, depressed sea level associated with an upwelling Kelvin wave is seen to propagate east of 180° W from the beginning of the TOPEX data to November, 1992 (Figure 1). This same depression of sea level at the equator may induce a westward propagating response seen in the TOPEX data off the equator upon reflection at the eastern boundary. At the same time, but farther to the west, a downwelling Kelvin wave is being excited by a westerly wind burst that began near 165°E in late October. This coherent elevation of sea level is seen to propagate eastward in the TOPEX data to 130°W with amplitude greater than 6 cm. This is followed by a second westerly wind burst at the end of 1992, that in turn, forces another downwelling Kelvin wave that propagates east of the dateline to 95°W. Note that for both downwelling Kelvin wave events there is a clear degradation in amplitude east of 130°W in both the TOPEX and TAO data sets. Similar behavior was also detected in Geosat, and has been attributed to the influence of upwelling favorable winds in the eastern portion of the basin. The presence of 2 m/s easterly wind anomalies in this region during December 1992 - March 1993 suggests this destructive interference may be at work again.
In mid-January 1993, easterly wind anomalies in the farwestern Pacific generate a sea level depression that propagates from 137°E, through the TOGA COARE domain, to at least 140°W. During April and May, both data sets depict a period of elevated sea level of 6-10 cm east of 130°W. This episode coincides with a 2 ms-1 relaxation of the equatorial easterlies near 145°W in April which may also be responsible for an off-equatorial response seen in the TOPEX data. In May-June both data sets indicate a depressed sea from 160°E to 1400W at a time of westerly wind anomalies in the same region. A few months later in July and August another upwelling event spans most of the equatorial basin. This is followed by a 4 ms-1 westerly wind anomaly west of the dateline in August and subsequently during September an eastward propagation of elevated sea level east of the date line.
The overall fidelity between the sea level variability of TOPEX and TAO is summarized by cross correlations and rms differences. In the central and western tropical Pacific and eastern equatorial Pacific there are large regions where the correlation is between 0.7-0.9 with rms differences less than 4 cm.
This is consistent with the general qualitative agreement noted in the previous time-longitude analysis. The greatest discrepancies between TOPEX and TAO are present in the northern and eastern tropical Pacific. In the east, the correlations are often less than 0.5 off the equator. North of the equator the rms differences are often greater than 5 cm. Such low correlations in the eastern Pacific were unexpected; they may be the result of a number of possibilities, e.g., poor temporal resolution of 20-30 day instability waves in the 10-day repeat TOPEX data, poor spatial resolution of the instability waves in the TAO data, imperfect water vapor retrieval over an area of strong and rapid sea surface temperature variations, or residual orbit error. Chief among the possible reasons for the discrepancies, however, may be error in the tidal corrections applied to the TOPEX data. The Schrama and Ray (1994) correction provided a noticeable improvement in our results near the equator in the eastern Pacific (correlations increased by 0.1-0.2 and rms differences dropped by 1-2 cm) as compared when using the Cartwright and Ray and Schwiderski tide models. Yet, even after having applied the Schrama and Ray tides there still remain unresolved discrepancies off the equator in the eastern equatorial Pacific. We would expect that comparisons between the two data sets will improve if the data are low-pass filtered for periods greater than 60 days in order to remove residual tidal errors and sampling errors pertaining to the instability waves.
In summary, with the recent deployment of more than 60 TOGA-TAO moorings in the equatorial Pacific, we have been able to do a quick-look comparison between the 0/500 db dynamic height and sea level estimated from the TOPEX altimeter during the first 506 days of the TOPEX/ POSEIDON mission This intercomparison was facilitated through the optimal interpolation of both sea level fields (relative to the 506 day mean) onto a common 10-day, 1° x 1° grid. During the verification phase, the TOPEX altimeter captured the major sea level signals associated with the continuation of the 1991-93 El Niño event. These sea level signals, though significant, were smaller than those observed by the GEOSAT altimeter during the 1986-87 El Niño. The largest amplitude sea level variability was evident during the first 30 cycles and appeared to be related to a train of downwelling Kelvin waves, generated in boreal winter and spring by westerly winds in the western and central Pacific.
These waves propagated all the way to the eastern Pacific where they affected sea surface temperature, and may have contributed to the prolongation of the 1991-93 El Niño event in the tropical Pacific. Along 5°N (not shown), both the data sets provide evidence of a westward propagating annual Rossby wave.
News
 Archives .
- Aviso Newsletter .
- Newsletter 1 .
- Newsletter 2 .
- Newsletter 3 .
- The new challenge.
- Validation results.
- T/P sea-state bias.
- T/P and the wind.
- T/P tidal solutions.
- New data set for tides.
- El Niño and T/P.
- T/P data.
- T/P contribution to inverse modeling.
- Assimilating T/P data into a numerical model.
- Operational assimilation of T/P and ERS-1 data.
- Outstandingly accurate mean sea level.
- T/P observes wave enhancement in the Agulhas current.
- Toward a homogeneous ERS - T/P data set.
- Newsletter 4 .
- Newsletter 5 .
- Newsletter 6.
- Newsletter 7 .
- Newsletter 8.
- Newsletter 9.
- Newsletter 10.
- Search.
- Front-page news.
- Image of the month .
- Operational news and status .