


Mean Sea Level as seen by other techniques
The satellites altimetry observing system allows to monitor nearly all oceans on earth since the 1990's, in a continuous and regular manner. This observing system has revolutionnised the ocean science but this is not the only observing system developed to monitor sea level. Other tehcniques, such as tide gauges, existed since a long time ago. Others like ARGO flaot and GRACE have been developped to complete and/or validate satellite altimetry data. The combination of allavailable data from the different observing system is a powerfull tool to understand better why and how sea level is varying.
Measurements and what they see
The different means of measuring sea level variations do not in fact observe exactly the same things.
| Technique | Observed part of mean sea level |
|---|---|
| Altimetry | total (steric+mass) |
| Grace | mass+Glacial Isostatic Adjustment (GIA) |
| Temperature/Salinity profiles (Argo) |
steric or thermosteric (temperature only) or halosteric (salinity only) |
| Tide gauges | total plus ground movements (including GIA) |
Tides gauges
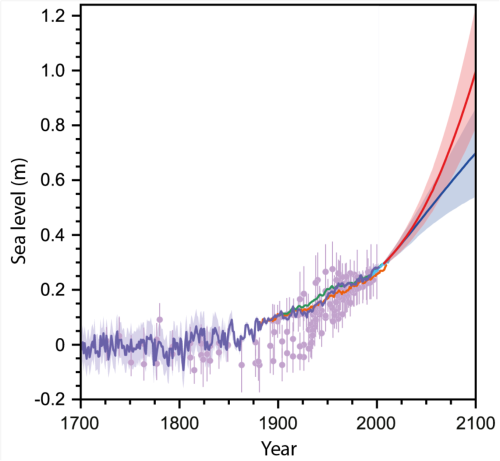
The longest sea level time series are provided by tide gauges. Some of them (not many) measured the sea level for more than a century. However, they support the effects of the movements of continents, and are very unevenly distributed around the globe: necessarily close to shore, but many more, and the oldest in Europe and the United States.
In situ temperature/salinity observations
Temperature and salinity, at the surface as in depth are measured in situ by Argo floats or XBTs. Variations of the thermosteric level (i.e. due to temperature only) or steric level (due to temperature and salinity both) are thus computed over the 0-700 m layer from temperature (T) or temperature and salinity (T/S) profiles. This technique thus enable to estimate mainly the effects of varying heat in the ocean. Fresh water inputs or evaporation too have an indirect effect on this measure, by their impact on salinity (but note that this does not take into account the variations of water masses in the ocean)
Gravimetry satellites: GRACE mission
Water masses changes in the ocean (addition of water or evaporation, water mass transports) modify Earth gravity field. Grace satellite enable to observe these variations every 30 days. Thanks to this mission, the quantity of water added in the ocean (from ice melts, in particular) can be estimated.
Models
Ocean models describe the ocean in three dimensions (horizontally and vertically) as well as its evolution over time (temporal dimension or fourth dimension). A model is a mathematical description of physical phenomena. For the ocean, as for the atmosphere, the mathematical model describes the movement of fluids (water, air) on the surface of the Earth, as well as transporting of heat (temperature) and matter (salts) associated with the fluid movements. This results in equations which describe the current, the temperature and the salinity at any place in the modelled zone and as a function of time.
References
- Ablain, M., A. Cazenave, G. Valladeau, S. Guinehut, 2009: A new assessment of the error budget of global mean sea level rate estimated by satellite altimetry over 1993-2008. Ocean Sci. 5:193-201
- Grinsted, A., J.C. Moore, S. Jevrejeva, 2007: Observational evidence of volcanic impact on sea level and the global water cycle, Proc. Natl. Acad. Sci. U.S.A. 104(50):19730-34
- Nicholls, R.J., and A. Cazenave, 2010: Sea-Level Rise and Its Impact on Coastal Zones, Science 328, 1517. doi: 10.1126/science.1185782.
- Rahmstorf S., 2007: A semi-empirical approach to projecting future sea level rise, Science 315:368
- Vermeer, M., and S. Rahmstorf, 2009: Global sea level linked to global temperature, Proc. Natl. Acad. Sci. U.S.A. 106(51), 21527.
Data
- Products guide.
 Products .
- Sea surface height products .
- Value-added products .
- Wind/wave products .
- Auxiliary products .
- Ice products .
- Ocean indicators products .
- El Niño Southern Oscillation - ENSO.
- Mean Sea Level .
- Data access.
- Processing & corrections.
- Other techniques.
- Validation.
- MSL Science issues.
- References.
- Kuroshio.
- Analysis of climate feedback PArameter Changes from Heat Evolution (APACHE).
- Ocean Heat Content and Earth Energy Imbalance .
- Barystatic and manometric sea level changes from satellite geodesy.
- Ionian Sea circulation.
- Ocean data challenges .
- Tide Gauges products.
- Data access .
- Product information .
- CALVAL .