


What causes the sea level to vary?
The sea level can vary over long periods for several reasons:
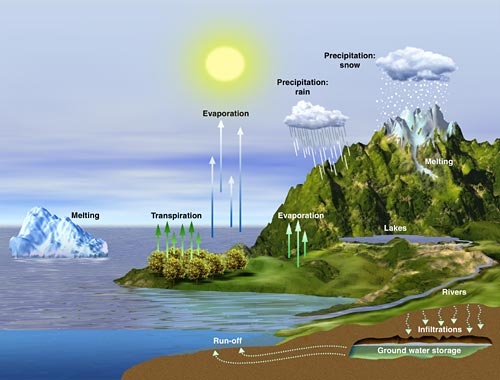
- water mass variations:
water can be added to the ocean, either by increased rain over the ocean, or run-off from the rivers; glaciers melting can also add water. On the reverse, more artificial reservoirs leads to a run-off decrease, and thus to less water being brought to the ocean. Increased evaporation can also decrease the water mass (as well as glaciation, as it happened during last Ice age, when sea level was about 100 m below the nowadays level)
- temperature variations:
water dilates when it warms, which leads to higher sea level. Among other things, it leads to sea level seasonal variations, and also year-to-year variations linked to climate events (e.g. El Niño). Temperature changes over longer time scale (global warming) have, of course, also an impact.
- salinity variations:
the saltier the water, the denser it is; thus saltier water will have a lower level. Salinity variations can occur by fresh water addition (increased run-off, rain, or ice melting), which decreases salinity, or by increased evaporation, or by glaciation, which increase salinity.
- ocean circulation changes:
changes in sea level can be due to changes in the ocean circulation. Over periods of ten years or more, the currents can shift position,
The main factors causing current global mean sea level rise are thermal expansion of sea waters and land ice loss. These contributions vary in response to natural climate variability and to global climate change induced by anthropogenic greenhouse gas emissions. Terrestrial waters little contribute to sea level rise.
Ocean warming
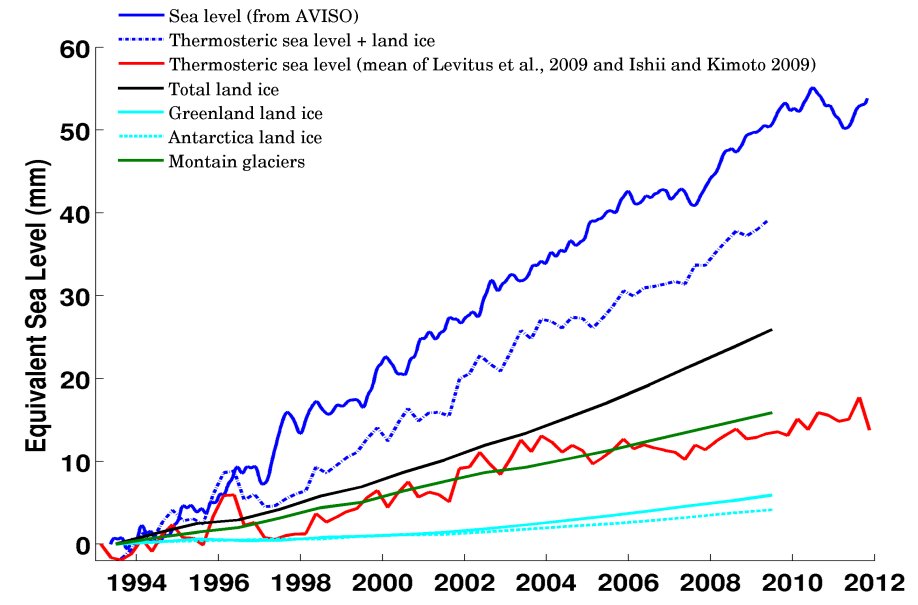
Analyses of in situ ocean temperature data collected over the past 50 years by ships and recently by Argo profiling floats indicate that ocean heat content, and hence ocean thermal expansion, has significantly increased since 1950 (Levitus et al., 2009, Ishii and Kimoto, 2009, Lymann et al., 2010). On average, over the satellite altimetry era (1993-2010), the contribution of thermal expansion to sea level rise is on the order of 1 mm/yr (Church et al., 2011, Cazenave and Llovel, 2011).
Glaciers melting
Being very sensitive to global warming, mountain glaciers have retreated worldwide during the recent decades, with significant acceleration since the beginning of the 1990s. From mass balance studies of a large number of glaciers, estimates have been made of the contribution of glacier's ice melt to sea level. For the period 1993-2010, the glacier contribution to sea level rise is estimated to 1 mm/yr (Steffen et al., 2010, Church et al., 2011, Pfeffer, 2011).
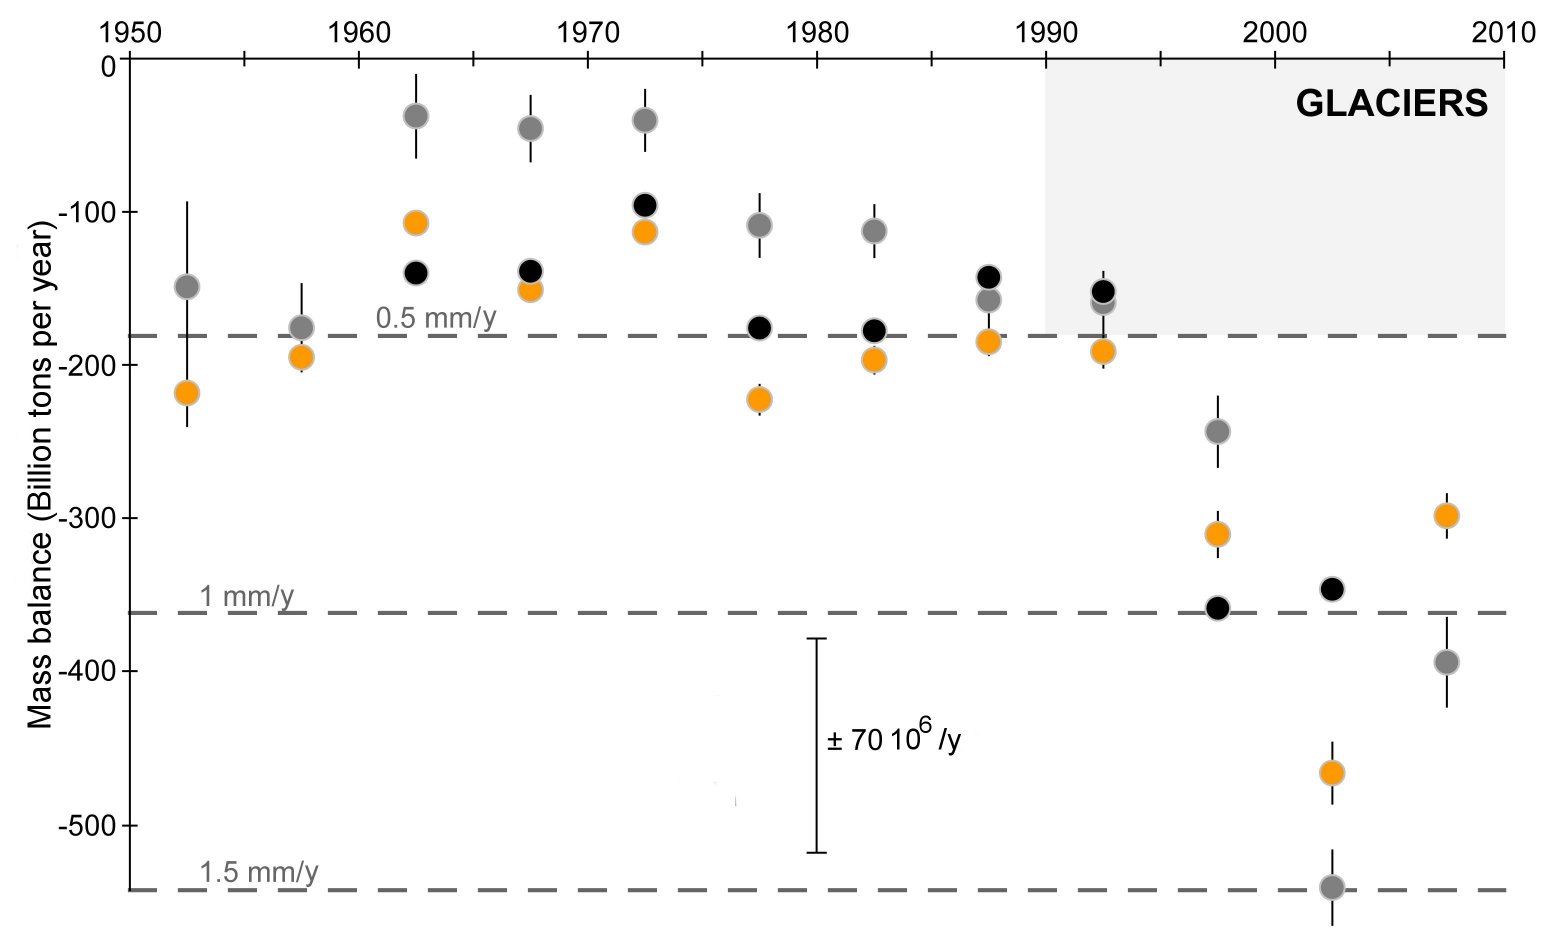
Evolution of glaciers mass balances (in gigatons per year). A zero balance means that the glacier has neither gained nor lost mass during the studied period. A negative balance indicates a loss of the glacier, which water is added to the ocean. To make easier the comparison, the same area was shaded on the three panels (see mass balance for Greenland and Antarctica bottom). The glaciers balances (Cogley J.G. compilation) are averaged over a 5-year period; the vertical lines represent the dispersion of measurements (standard deviation) which is lower than the uncertainty, this latest being about 70.106 / year. Credits LEGOS/Berthier et al.
Ice sheets
While little was known before the 1990s on the mass balance of the ice sheets because of inadequate and incomplete observations, different remote sensing techniques available since then (e.g., airborne and satellite radar and laser altimetry, Synthetic Aperture Radar Interferometry -InSAR-, and since 2002, space gravimetry from the GRACE mission) have provided important results on the changing mass of Greenland and (west) Antarctica.
These data indicate that both ice sheets are currently loosing mass at an accelerated rate (e.g., Steffen et al., 2010). In effect, most recent mass balance estimates from space-based observations (e.g., GRACE and InSAR) show ice mass loss acceleration in the recent years (e.g., Chen et al., 2009, Velicogna, 2009, Rignot et al., 2011).
For the period 1993-2003, <15% of the rate of global sea level rise was due to the ice sheets (IPCC, 2007). But their contribution has increased up to ~75% since 2003-2004. Although not constant through time, on average over 1993-2010, ice sheets mass loss explains ~20% (0.6 mm/yr) of the rate of sea level rise (Steffen et al., 2010, Cazenave and Remy, 2011, Church et al., 2011).
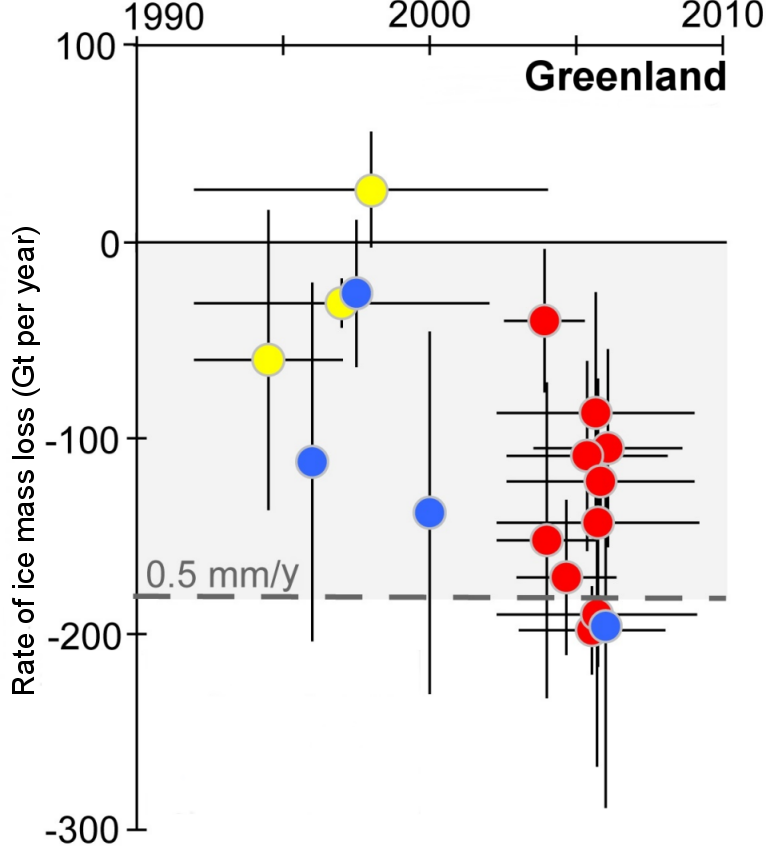
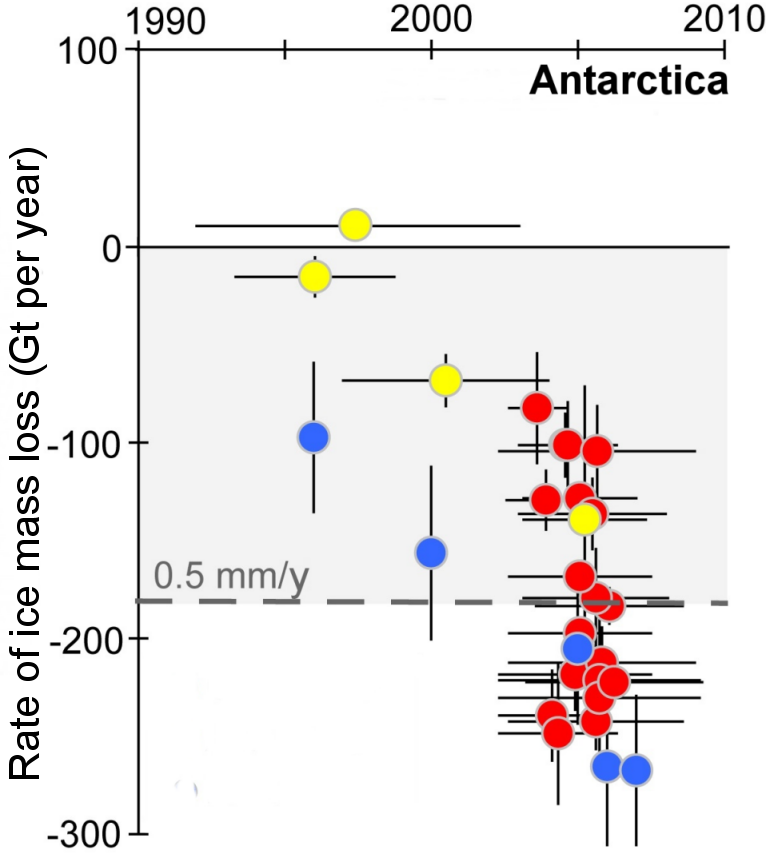
Evolution of ice sheets mass balances, in Greenland (left) and Antarctica (right) measured by various remote sensing methods since 1992: radar and laser altimetry (yellow), InSAR radar interferometry (blue) and space gravimetry Grace (red). These measurements were recorded over various periods : horizontal bars indicate this period whereas the vertical lines indicate the uncertainties on the measurements. A zero balance means that ice sheet has neither gained nor lost mass during the studied period. A negative balance indicates a loss of the ice sheet, which water is added to the ocean. The horizontal dashed lines correspond to the equivalent sea level rise (mm / year). Credits LEGOS/Berthier et al.
Sea level budget of the ~last two decades
Although none of the climate factors discussed above evolve linearly with time, on average over the 1993-2010 time span, ocean warming and glaciers melting have roughly contributed by ~30% each. The ice sheet contribution is slightly less (~20%). Over the altimetry era, the sea level budget is almost closed given the uncertainties of each contribution.
Regional variability
The regional variability in sea level trends is mainly due large-scale changes in the density structure of the oceans in response to forcing factors (e.g., wind stress, heat and fresh water exchange at the sea-air interface) and associated changes in ocean circulation.
The largest regional changes in sea level trends result from ocean temperature changes (i.e., from non uniform thermal expansion) but in some regions, changes in water salinity is also important (Bindoff et al., 2007).
Self-gravitation, elastic and visco-elastic deformations of the solid Earth in response to water mass redistribution associated with present day and past land ice melt (the latter being called Glacial Isostatic Adjustment -GIA-) also cause regional variability in sea level (Milne et al., 2009, Tamisiea and Mitrovica, 2011). These effects are currently very small compared to steric effects but may become important in the future if the ice sheet contribution increases.
Observations over the past few decades show that trend patterns in thermal expansion are not stationnary but fluctuate both in space and time in response to internal/natural modes of variability of the climate system such as ENSO (El Nino-Southern Oscillation), IOD (Indian Ocean Dipole), NAO (North Atlantic Oscillation) and PDO (Pacific Decadal Oscillation) (Bindoff et al., 2007, Meyssignac et al. 2012a,b).
As a result, sea level trends patterns observed by satellite altimetry are transient features. On longer time scales, these patterns are expected to be different from what is observed over the altimetry era. Past sea level reconstructions covering the second half of the 20th century confirm this (e.g., Ray and Douglas, 2011, Hamlington et al., 2011, Meyssignac et al., 2012a).
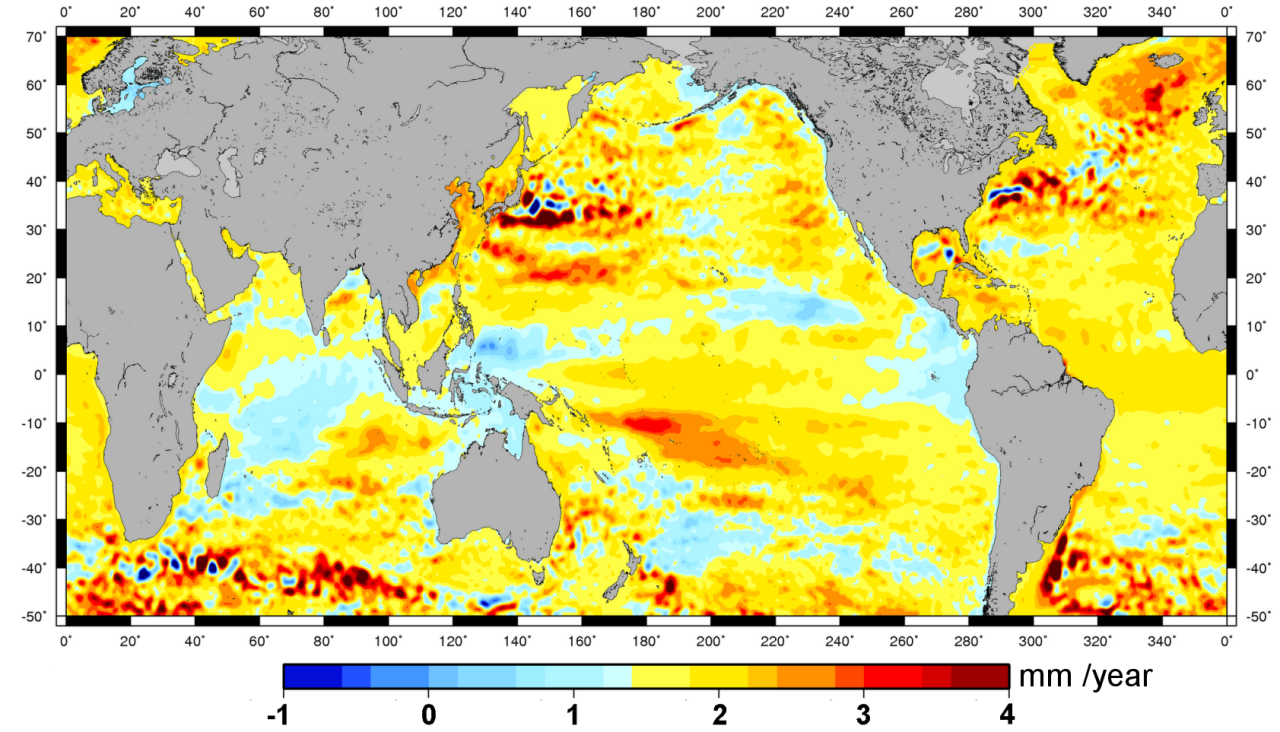
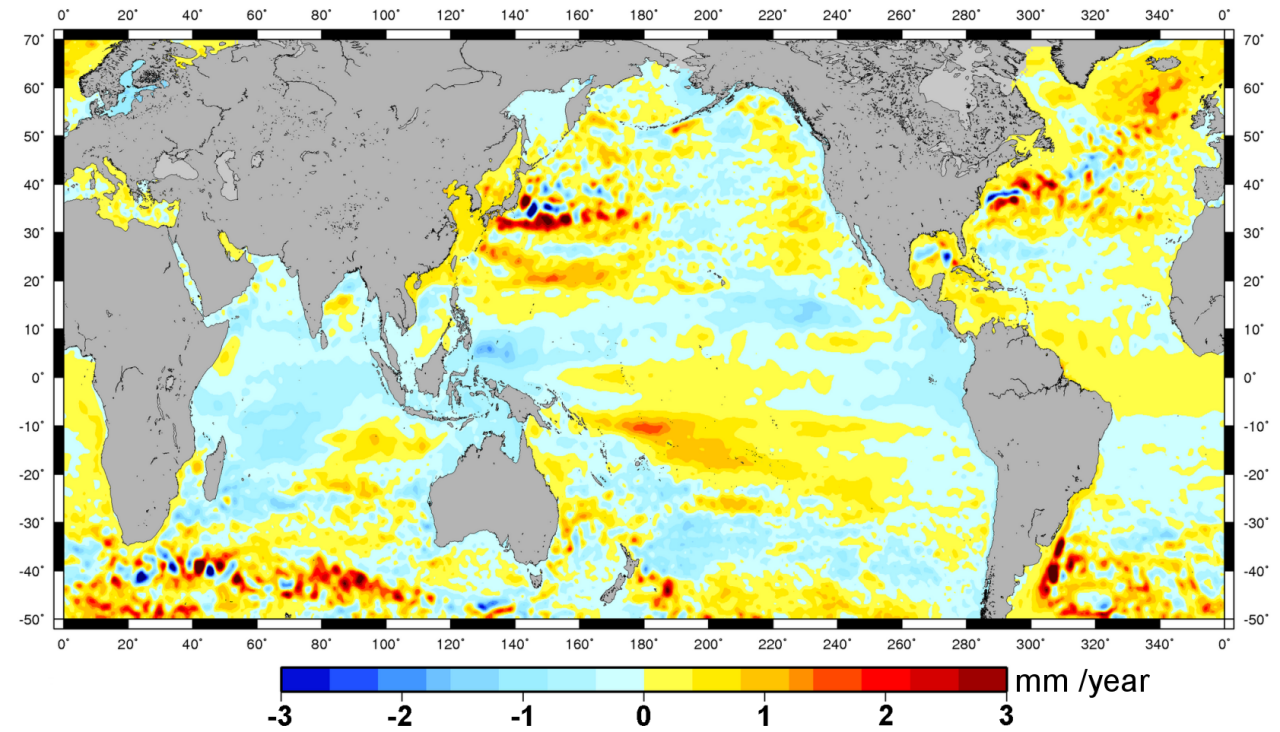
Map of spatial trend patterns of reconstructed sea level between 1950 and 2010. Left: uniform global mean trend of 1.8 mm/year is applied; Right: a uniform global mean trend of 1.8 mm/year has been removed (Credits : Meyssignac et al., 2012a).
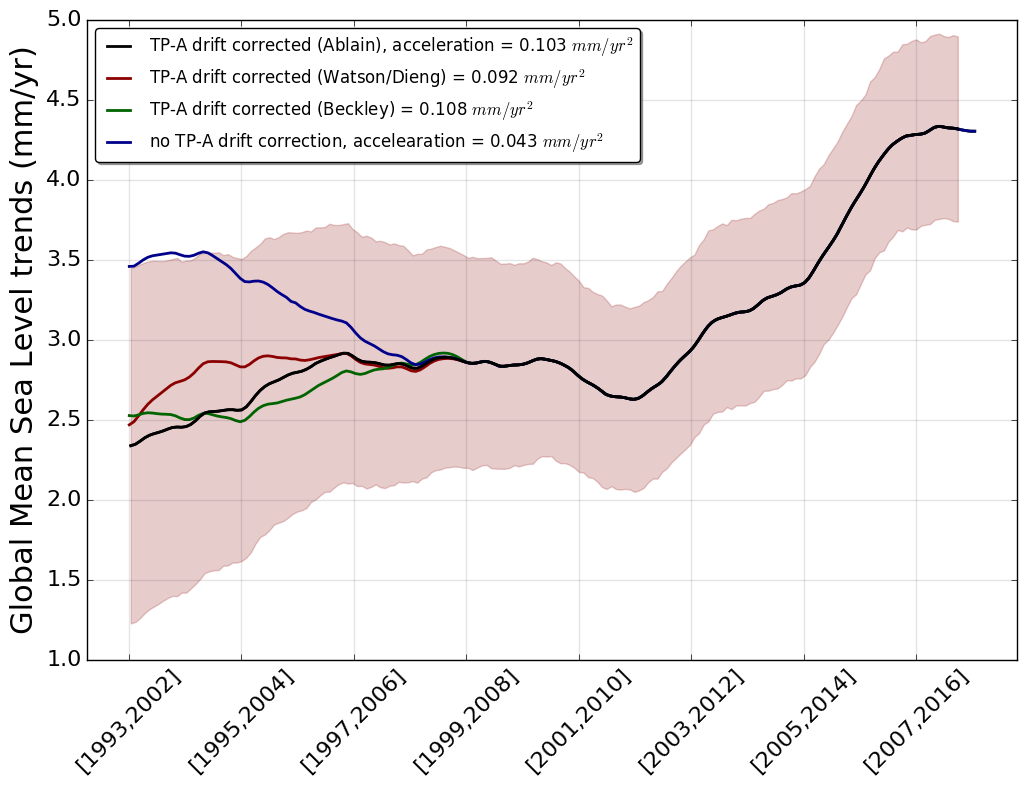
GMSL acceleration
The GMSL rate after correction of the TOPEX-A drift amounts to 3.1 mm/yr over 1993-2017 (same value for all correction currently proposed). This corresponds to a mean sea level elevation of about 7.5 cm over the whole altimetry period. More importantly, the GMSL curve shows a net acceleration, estimated at 0.080 mm/yr² (Chen et al. 2017; Dieng et al. 2017) and 0.085 mm/yr² (Nerem et al., 2018). This acceleration is illustrated in the figure below, where GMSL trends are computed over 10-year moving windows. GMSL trends are close to 2.5 mm/yr over 1993-2002 and 3.0 mm/yr over 1996-2005. After a slightly smaller trend in 2002-2011, the 2008-2017 trend reaches 4.2 mm/yr. Uncertainties (90% confidence level) associated to these 10-year trends regularly decrease through time from 1.3 mm/yr over 1993-2002 (corresponding to T/P data) to 0.65 mm/yr over 2008-2017 (corresponding to Jason-2 and Jason-3 data).
Bibliography
- Ablain, M., Legeais, J. F., Prandi, P., Marcos, M., Fenoglio-Marc, L., Dieng, H. B., Benveniste, J., Cazenave, A. (2017). Satellite altimetry-based sea level at global and regional scales. In: Cazenave A., Champollion N., Paul F., Benveniste J. (eds) Integrative Study of the Mean Sea Level and Its Components. Space Sciences Series of ISSI, vol 58. Springer, Cham. DOI: 10.1007/978-3-319-56490-6_2
- Beckley, B. D., Callahan, P. S., Hancock, D. W., Mitchum, G. T., & Ray, R. D. (2017). On the "Cal-Mode" Correction to TOPEX Satellite Altimetry and Its Effect on the Global Mean Sea Level Time Series. Journal of Geophysical Research: Oceans, 122(11), 8371-8384. DOI: 10.1002/2017JC013090
- Berthier E., Vincent C., Durand G .& Krinner G. Bilan de masse des glaciers et des calottes polaires. Jeandel C. & Mosseri R. (Eds.): Le climat à découvert. Outils et méthodes en recherche climatique. CNRS Edition, 2011.
- Bindoff, N., Willebrand J., Artale V. , Cazenave A., Gregory J. , Gulev S., Hanawa K., Le Quéré C., Levitus S., Nojiri Y., Shum C.K., Talley L., Unnikrishnan A., Observations: oceanic climate and sea level. In: Climate change 2007: The physical Science Basis. Contribution of Working Group I to the Fourth Assessment report of the Intergouvernmental Panel on Climate Change [Solomon S., D. Qin, M. Manning, Z. Chen, M. Marquis, K.B. Averyt, M. Tignor and H.L. Miller (eds.)]. Cambridge University Press, Cambridge, UK, and New York, USA, 2007.
- Cazenave A., and Llovel W. 2010. Contemporary sea level rise, Annual Review of Marine Science, 2, 145-173.
- Cazenave, A., F. Remy, 2011. Sea level and climate: measurements and causes of changes, Interdisciplinary Reviews: Climate Change, 2(5), 647-662, , doi:10.1002/wcc.139.
- Chen J.L., Wilson C.R., Blankenship D. and Tapley B.D., 2009. Accelerated Antarctic ice loss from satellite gravity measurements. Nature Geoscience, 2(12): 859-862.
- Chen, X., Zhang, X., Church, J. A., Watson, C. S., King, M. A., Monselesan, D., Legresy, B., Harig, C. (2017). The increasing rate of global mean sea-level rise during 1993–2014. Nature Climate Change, 7, 492-495. DOI: 10.1038/nclimate3325
- Church, J.A., N.J. White, L.F. Konikow, C.M. Domingues, J.G. Cogley, E. Rignot, J.M. Gregory, M.R. van den Broeke, A.J. Monaghan, and I. Velicogna, 2011. Revisiting the Earth's sea-level and energy budgets from 1961 to 2008, Geophys. Res. Lett., 38, L18601, doi:10.1029/2011GL048794.
- Dieng, H. B., Cazenave, A., Meyssignac, B., & Ablain, M. (2017). New estimate of the current rate of sea level rise from a sea level budget approach. Geophysical Research Letters, 44(8), 3744-3751. DOI: 10.1002/2017GL073308
- IPCC 4th Assessment Report, 2007. Climate change 2007: The physical Science Basis. Contribution of Working Group I to the Fourth Assessment report of the Intergouvernmental Panel on Climate Change [Solomon S., D. Qin, M. Manning, Z. Chen, M. Marquis, K.B. Averyt, M. Tignor and H.L. Miller (eds.)]. Cambridge University Press, Cambridge, UK, and New York, USA.
- Hamlington B.D., Leben, R., Nerem, S., Han, W., Kim, K.Y. 2011. Reconstructing sea level using cyclostationary empirical orthogonal functions, J. Geophys. Res., doi: 10.1029/2011JC00752.
- Levitus S., Antonov J.L., Boyer T.P., Locarnini R.A., Garcia H.E. and Mishonov A.V., 2009. Global Ocean heat content 1955-2008 in light of recently revealed instrumentation, Geophys. Res. Lett., 36, L07608, doi:10.1029/2008GL037155
- Llovel W, Guinehut S and Cazenave A, 2010. Regional and interannual variability in sea level over 2002-2009 based on satellite altimetry, Argo float data and Grace ocean mass, Ocean Dynamics, 60,1193-1204.doi: 10.1007/s10236-010-0324-0.
- Lyman J.M., Godd S.A., Gouretski V.V., Ishii M., Johnson G.C., Palmer M.D., Smith D.M., Willis J.K. 2010. Robust warming of the global upper ocean, Nature, 465:334-337. doi:10.1038/nature09043.
- Meyssignac B., Llovel W., Becker M. and Cazenave A., 2012a: An assessment of two-dimensional past sea level reconstructions over 1950 -2009 based on tide gauge data and different input sea level grids, Surveys in Geophysics, published online 2012/01/24, DOI 10.1007/s10712-011-9171-x.
- Meyssignac B., Salas y Melia D.,Becker M.,Llovel W., Cazenave A., 2012b: Tropical Pacific spatial trend patterns in observed sea level: internal variability and/or anthropogenic signature? Clim. Past, 8, 787-802, 2012, doi:10.5194/cp-8-787-2012
- Milne G., Gehrels W.R., Hughes C. and Tamisiea M., 2009. Identifying the causes of sea level changes, Nature Geoscience, vol 2, 471-478.
- Nerem, R. S., Beckley, B. D., Fasullo, J. T., Hamlington, B. D., Masters, D., & Mitchum, G. T. (2018). Climate-change-driven accelerated sea-level rise detected in the altimeter era. Proceedings of the National Academy of Sciences, 201717312. DOI: 10.1073/pnas.1717312115
- Pfeffer, W.T., 2011. Land ice and sea level rise: A thirty-year perspective, Oceanography, 24(2), 94-111, doi:10.5670/oceanog.2011.30.
- Ray, R. and Douglas, B. Experiments in reconstructing twentieth-century sea levels, Progress in Oceanography, 2011, in press.
- Rignot E., Velicogna I., van den Broeke M.R., Monaghan A. and Lenaerts J. 2011. Acceleration of he contribution of the Greenland and Antarctic ice sheets to sea level rise, Geophys. Res. Lett., 38, L05503.
- Steffen K. et al., 2010. Cryospheric contributions to sea level rise and variability, in Understanding sea level rise and variability, J. Church, P. L. Woodworth, T. Aarup, and S. Wilson, Eds., Blackwell Publishing.
- Tamisiea, M.E., and J.X. Mitrovica. 2011. The moving boundaries of sea level change: Understanding the origins of geographic variability. Oceanography 24(2):24-39, http://dx.doi.org/10.5670/oceanog.2011.25.
- Velicogna I,. 2009. Increasing rates of ice mass loss from the Greenland and Antarctic ice sheets revealed by Grace. Geophys. Res. Lett., 36.
- Watson, C. S., White, N. J., Church, J. A., King, M. A., Burgette, R. J., & Legresy, B. (2015). Unabated global mean sea-level rise over the satellite altimeter era. Nature Climate Change, 5(6), 565. DOI: 10.1038/nclimate2635
Book:
- Understanding sea level rise and variability, J. Church, P. Woodworth, T. Aarup and W. S. Wilson et al. Editors, Wiley-Blackwell, 2010.
Data
- Products guide.
 Products .
- Sea surface height products .
- Value-added products .
- Wind/wave products .
- Auxiliary products .
- Ice products .
- Ocean indicators products .
- El Niño Southern Oscillation - ENSO.
- Mean Sea Level .
- Data access.
- Processing & corrections.
- Other techniques.
- Validation.
- MSL Science issues.
- References.
- Kuroshio.
- Analysis of climate feedback PArameter Changes from Heat Evolution (APACHE).
- Ocean Heat Content and Earth Energy Imbalance .
- Barystatic and manometric sea level changes from satellite geodesy.
- Ionian Sea circulation.
- Ocean data challenges .
- Tide Gauges products.
- Data access .
- Product information .
- CALVAL .