


Drought and flood in the Amazon basin
Image of the Month - April 2010
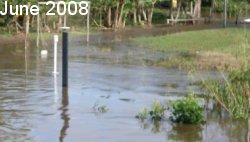
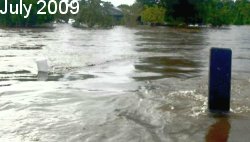
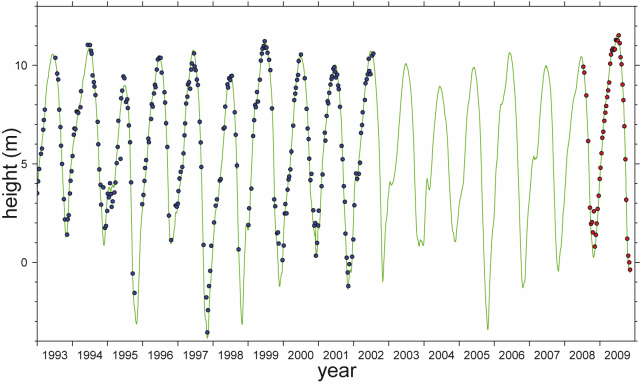
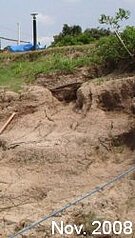
Amazon level measured at Manaus (Brazil) by tide gauges (green curve) and by Topex/Poseidon and Jason-2 on track #063 (blue and red dots respectively); Photographs of the same area (note the black tide gauge and the white limnograph on all pictures) taken during flood season 2008 and 2009 (top, the latter being especially high), and dry season 2008 (right) (Credits J. Santos da Silva (IRD/Universidade Federal do Rio de Janeiro), photos by D. Medeiros Moreira (CPRM, Brazil))
Altimetry satellites were meant at first for ocean. However, they are taking measurements all over the Earth -- ocean, land or ice. Thus the idea, initiated with Topex/Poseidon, of using altimetry data over lakes, and even rivers. The biggest of them, the Amazon, of course was among the first where the idea was tested, all the more since it shows impressive variations between seasons (up to 12 m). This very high amplitude is one of the problems of in situ measurements in the Amazon basin, since it requires not one but a series of gauges cross to the shores to be able to monitor it.
A Cnes project to process altimetry data for coastal and hydrology applications ("Pistach" project) provides data over the region, giving access to the surface elevation beneath the Jason-2 tracks every 10 days. The data are available through the Aviso web (see experimental Coastal and Hydrology products). The recent variations of the Amazon level, including during the exceptional flood of 2009 are thus monitored in near-real time.
See also:
- Data: experimental Coastal and Hydrology products
- Image of the Month, May 2009: Flood in the Zambezi basin
- Image of the Month, Oct. 2001: The Amazon under close surveillance
- Applications: Hydrology and land
Website on this subject:
- Hydroweb (Legos/CNRS)
- Hybam project (Geodynamical, hydrological and biogeochemical control of erosion/alteration and material transport in the Amazon basin)
References:
- Calmant S., A-E. Souza, J. Santos da Silva, F. Sayler, O. Rotunno Filho, D. Medeiros Moreira, 2009: Validation of Jason-2 over the Amazon basin rivers, OSTST meeting, Seattle, June 2009.
News
 Archives .
- Aviso Newsletter .
- Search.
- Front-page news.
- Image of the month .
- 2026 .
- 2025 .
- 2024 .
- 2023 .
- 2022 .
- 2021 .
- 2020 .
- 2019 .
- 2018 .
- 2017 .
- 2016 .
- 2015 .
- 2014 .
- 2013 .
- 2012 .
- 2011 .
- 2010 .
- Dec. 2010: An island "seen" by altimeter.
- Nov. 2010: Mixing Argo and altimetry to estimate salt.
- Sep. 2010: ASAR vs altimetry South of Africa.
- Oct. 2010: Envisat measures up Antarctica.
- Aug. 2010: Altimetry helps search for a wreck.
- July 2010: North Atlantic Tides.
- June 2010: Penguins at large.
- May 2010: Finer currents.
- Apr. 2010: Drought and flood in the Amazon basin.
- Mar. 2010: Eddies in the Gulf of Alaska.
- Feb. 2010: Arctic sea ice shrinks and thins.
- Jan. 2010: Surface mirrors the deep.
- 2009 .
- 2008 .
- 2007 .
- 2006 .
- 2005 .
- 2004 .
- 2003 .
- 2002 .
- 2001 .
- 2000 .
- 1999 .
- 1998 .
- Operational news and status .