News
Altimetry applications in videos : Oil Spill
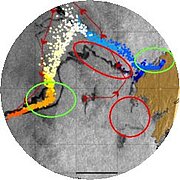
The contribution of satellites to the detection, monitoring and forecasting of oil drifts has been demonstrated. Thanks to synergies between stakeholders, a continuous monitoring procedure is about to become operational in certain pre-defined areas of interest.

 See the Oil Spill video: flash (9 Mo) or mpeg (31 Mo)
Oil spill pollution at sea is both environmentally and economically disastrous for coastal regions. Besides accidental pollution, illegal discharges (degassing, deballasting and operational discharge from a vessel's propulsion system) represent a large share of global pollution.
Although many preventive solutions have been recommended or are currently in force (double hull tankers, separate ballast tanks for engine oil residues, treatment plants in ports, navigational aids, automatic identification systems, traffic separation schemes, etc.), legal loopholes or economic shortcuts still influence the decisions of oil companies for such dangerous, illegal practices.
Sea level altimetry data, combined with data from other satellites for temperature and wind pressure measurements, and in situ data, are input into the Mercator ocean forecasting models. These data are themselves assimilated in the Météo France oil slick drift model. Called MOTHY, this drift model has been compared to two other models and was used as a benchmark during the Prestige accident in November 2002 off the coast of Galicia.
In the case of deliberate, hidden discharges, other satellite sensors are used to detect oil slicks. Essentially, a layer of pollutant makes the sea surface denser, creating a zone of calm and altering sea surface roughness. This is visible on the radar images provided by the SAR instruments (ERS, Envisat, Radarsat).
Today, thanks to synergies between stakeholders, a continuous monitoring procedure is about to become operational in certain pre-defined areas of interest. By combining real-time analysis of radar images with a list of maritime traffic in the same area at the same time, ship polluters are able to be tracked.
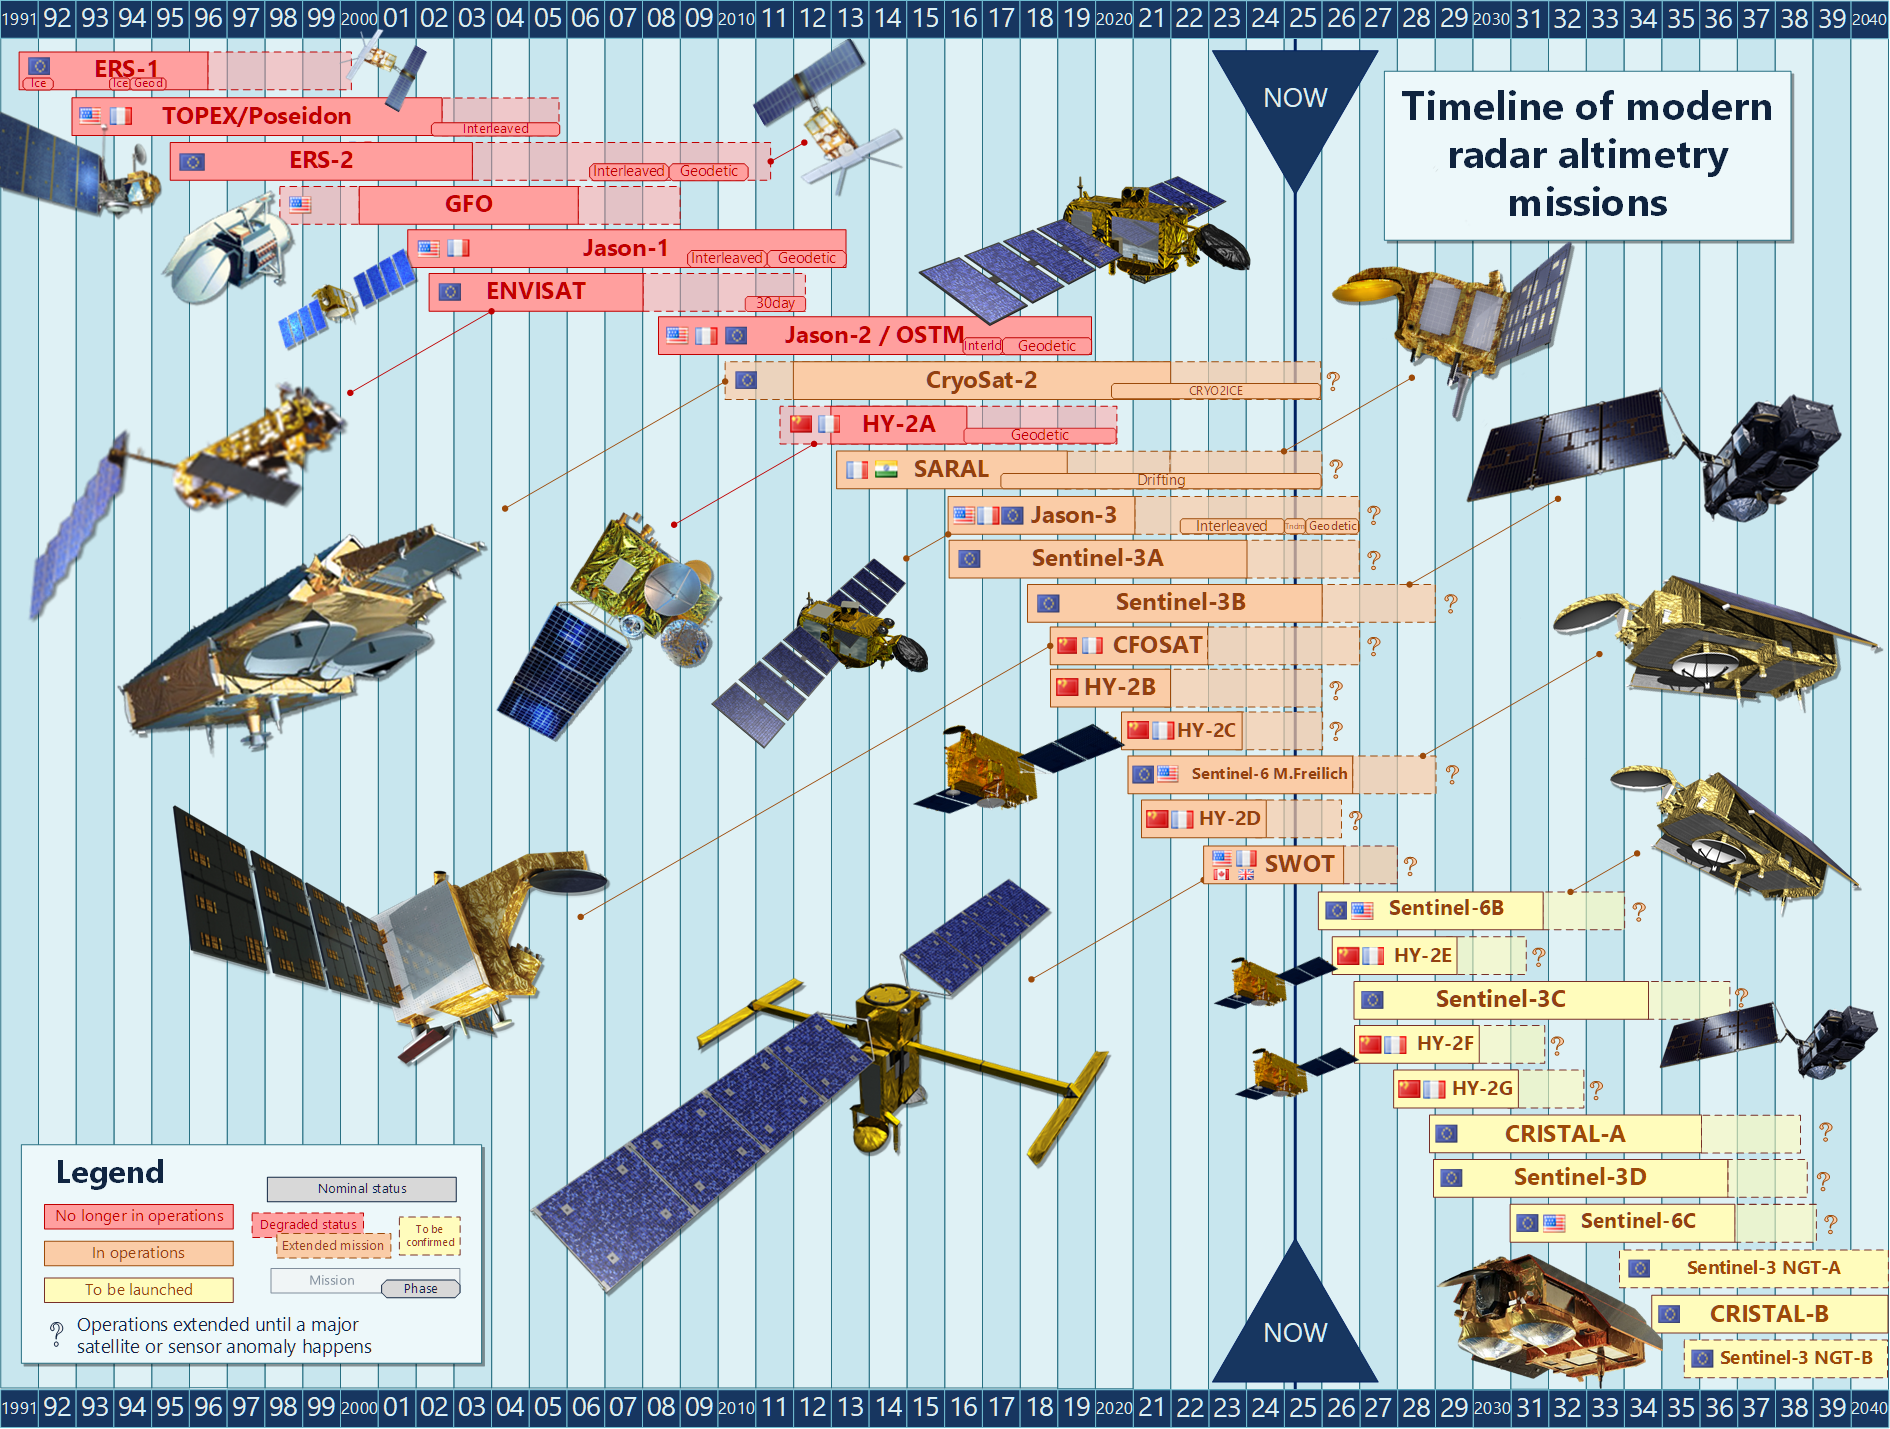
With new sea level data, the Jason-2 altimetry satellite, from June 2008 onwards, will contribute to improving the oil slick drift models. And with a new measurement processing algorithm onboard, the radar altimeter will be able to better distinguish coastlines, where forecasting models suffer from uncertainties due to local currents and winds.
Further information:
- Mission <link internal-link>Jason-2
- external websites :
- Mercator Océan: <link http: www.mercator-ocean.fr documents actualites projection projection_n2_en.pdf _blank external-link-new-window>Mercator and Météo France team up for the Prestige disaster. Projection Mercator #2 , Nov. 2003.
- Mercator Océan: <link http: www.mercator-ocean.fr documents lettre lettre_29_en.pdf external-link-new-window>Oil spill fate forecasting in the MERSEA Integrated Project. Mercator Ocean Quaterly Newsletter 329, April 2008 (for specialists).
- Météo France: <link http: www.meteorologie.eu.org mothy _blank external-link-new-window>the Mothy drifting model (in french)
- <link http: cleanseanet.emsa.europa.eu index.html _blank external-link-new-window>EMSA, Cleanseanet: European system developed for the detection of oil slicks at sea using satellite surveillance.
- <link http: www.marees-noires.com _blank external-link-new-window>Black tides (Cedre)


