


Frequently asked questions
Registration/data access
/
- How can I register?
-
Please, to register for AVISO+ products, fill the registration form available here.
Please give us some details about your motivation. Insert A-Z letters, numbers, '.', '-', '_' and spaces only!. Note especially that the character ',' (comma) is not allowed for the moment in the motivation field.
Category: Registration/data access
Data and processing questions
/
Altimetry questions
/
- ABC of Altimetry: SSH, SLA, ADT, MSS, MDT
-
The altimeter measures the ‘Altimeter Range’ which is the distance between the center of mass of satellite to the surface of the Earth (see Figure below). This allows computing the ‘Sea Surface Height’ (SSH) which is the height of the sea surface above the reference ellipsoid. The ‘Satellite Altitude’ refers to the distance of the center of mass of the satellite above a reference point. The reference point will usually be either on the reference ellipsoid or the center of the Earth.
SSH = Satellite Altitude - Altimeter Range – CorrectionsThe ‘Corrections’ due to environmental conditions need to be applied in order to retrieve the correct ‘Sea Surface Height’.
The Mean Sea Surface (MSSN) is the temporal mean of the SSH over a period N. It is a mean surface above the ellipsoid of reference and it includes the Geoid.
MSSN=<SSH>N
The Sea Level Anomaly (SLAN) is the anomaly of the signal around the time-mean component. It is deduced from the SSH and MSSN :
SLAN = SSH – MSSN
The Mean Dynamic Topography (MDTN) is the temporal mean of the SSH above the Geoid over a period N.
MDTN = MSSN – Geoid
The Absolute Dynamic Topography (ADT) is the instantaneous height above the Geoid. The geoid is a gravity equipotential surface that would correspond with the ocean surface if ocean was at rest (i.e. with no currents under only the gravity field). Then, when the ocean is also influenced by wind, differential heating and precipitation and other sources of energy, the ocean surface moves from the geoid. Thus, the departure from the geoid (MDT) provides information on the mean effect on SSH from ocean dynamics.
The ADT is the sum of the SLAN and MDTN:
ADT= SLAN + MDTN = SSH - MSSN + MDTNThe reference period N considered can be changed as described in Pujol et al. (2018). Currently it is 1993-2012.
The Mean profile is the mean of altimeter measurements along the satellite's tracks. It can be used as reference for computing SLA for the same satellite. It is an along-track data (not distributed)
The MSL (Mean Sea Level) is a trend (a number of mm/year), often given with respect to time as a curve.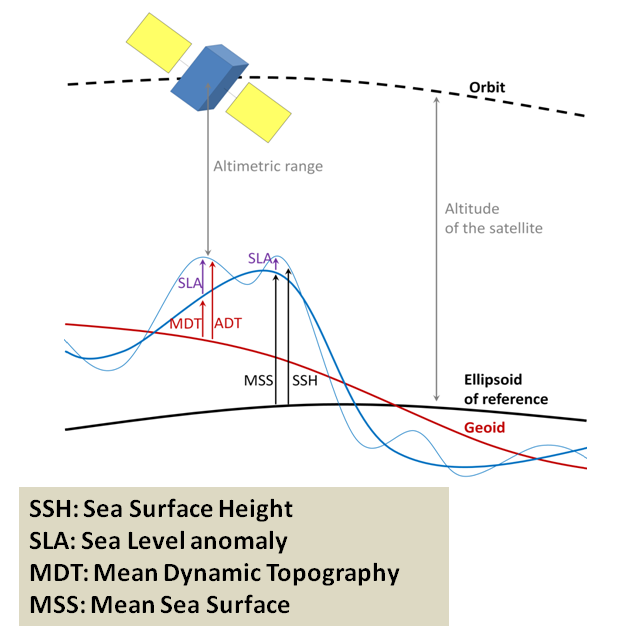
Reference:
Pujol, M.-I., Schaeffer, P., Faugère, Y., Raynal, M., Dibarboure, G., & Picot, N. (2018). Gauging the improvement of recent mean sea surface models: A new approach for identifying and quantifying their errors. Journal of Geophysical Research: Oceans, 123. https://doi.org/10.1029/2017JC013503 .Category: Altimetry

Applications questions
/
- Is it possible to estimate geostrophic currents from altimetry data?
-
Satellite altimetry allows to measure the Sea Surface Height (SSH) with a few centimeters precision. Appart from the equatorial band (ie, 5°N,5°S), the geostrophy can be assumed with a good certainty: it means that the slope of the sea surface measured by the altimeter along the satellite track is assumed to be DYNAMIC TOPOGRAPHY. In other word, it means that this slope is directly related to the pressure gradient at the sea surface, and thus, to a GEOSTROPHIC VELOCITY at the surface.
Category: Altimetry and Doris applications
Doris questions
/
- How the Doppler effect with Doris can give the distance between the satellite and the Earth?
-
Doris can give the position of a satellite because it compares a model of orbit (giving position and velocity) with its measurements:
Measurement data for permanent network beacons are processed to yield the satellite's precise trajectory. This processing includes modelling of forces acting on the satellite (terrestrial gravitation, etc.) in order to determine its precise trajectory.Category: Doris system
Figures marked "Aviso", are copyright Cnes/CLS, but please feel free to use them, conditional on the figures not being altered, and their source being acknowledged, and with a link to this site where possible.
All other figures are copyrighted. Please do not copy without the owner's permission.