


News
Altimetry applications in videos: Monitoring Hurricanes
Cyclones are intense meteorological phenomena that get their energy from the ocean's heat. Altimetry satellites have made a significant contribution to the prediction of trajectories and intensities by collecting data on sea surface height, wind speed and wave height.
 See the video Monitoring hurricanes: flash (9 Mo) or mpeg (26 Mo)
Cyclones are intense meteorological phenomena that get their energy from the ocean's heat. The main list of ingredients that can lead to a cyclone is known, but each element must be properly combined under very specific conditions. We currently know that a depression in the atmosphere above a reservoir of hot ocean waters (warmer than 26°C to a depth of 60 metres) creates the initial conditions. The high temperature of the upper layers of the ocean allows intense evaporation and humidity transfers from the ocean to the atmosphere. The differences in temperature and pressure between the ocean surface and the upper layers of the atmosphere cause these masses of air to rise vertically. The air is thus stirred and sheared vertically to feed and pump up the machine with water vapour. The recipe will only work if one last force is present: at a distance far enough from the equator, the Coriolis force (force generated by the Earth's rotation) completes the mixing, incorporating the elements one at a time into a whirlwind type motion to end up with this typical shape: a spiral-shaped mass of cumulonimbus clouds, with a diameter of 500 to 1,000 km, whipped up around a calm zone, the eye of the hurricane. .
The monster is not very quick - it only moves at about 20 or 30 km/h, but the speed of the peripheral winds is quite impressive. The force of the wind determines the intensity of a cyclone. From a 'tropical depression' to a 'tropical storm', the winds are less than 117 km/h. For winds at or above 118 km/h, and sometimes more than 249 km/h, the phenomena is called a tropical cyclone (or hurricane, or typhoon depending on the ocean basin), according to categories defined in the Saffir-Simpson scale
Given the devastating effects due to the wind, as well as the rain and the waves, it is important to detect the formation of these phenomena and to predict their trajectory and intensity. Onboard meteorological sensors and radar and satellite images have revolutionised cyclone prediction by enabling better estimates of the dimension of cyclones, by observing their structures in detail, and by measuring the amount of rainfall. More recently, altimetry satellites have made a significant contribution to the prediction of trajectories and intensities by collecting data on sea surface height, wind speed and wave height.
Measurements of significant wave height (SWH), deduced from the waveform of the echo from the radar altimeter, are assimilated in near real time in sea state forecasting models in order to considerably improve their performance. Along with in situ buoys, altimeter satellites revealed wave heights of more than 15 m in the Bay of Biscay, observed during the storm on 9 December 2007.
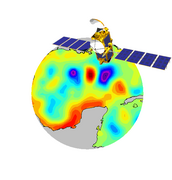
By directly measuring the sea surface height, altimetry identifies humps at places where the upper layer of the ocean has dilated due to higher temperatures. Altimetry is therefore capable of finding these warm eddy areas whose hurricane heat potential is proportional to the underlying volume of warm water, i.e. the higher the temperature of the water column (and not only the temperature of the ocean's surface), the more likely it is that the cyclone will gain strength when it passes. This is what was seen when hurricane Katrina, in August 2005, crossed the Gulf of Mexico. The cyclone got stronger, reaching category 5, by feeding on the warm waters of the anticyclonic eddy coming from the Yucatan current.
The launch of the Jason-2 satellite in June 2008 will enable this work to continue in order to detect the areas where cyclones intensify and to understand the major role played by the ocean's upper layer.
Further information:
- Applications : <link internal-link>Hurricanes, <link internal-link>Atlantic storm on December 9, 2007
- Newsletter #9, 2003 : <link http: www.aviso.oceanobs.com fileadmin documents kiosque newsletter news09 goni_uk.pdf _self>Using satellite altimetry to identify regions of hurricane intensification, Goni and al. pdf (1.3 Mo).
- Newstand: <link http: www.aviso.oceanobs.com en newsstand links _top external-link-new-window>related-links on hurricanes
- Poster : <link fileadmin documents ostst lefevrejm.pdf download>Operational assimilation of altimeter wind/wave data, JM. Lefèvre, SWT 2004 (pdf)
- External websites :
- Mercator, <link http: www.mercator-ocean.fr html produits buoc buoc_n12 buoc_n12_en.html external-link-new-window>Interaction between Katrina and the Mercator Ocean
- Nasa, <link http: www.nasa.gov vision earth environment hurricane_recipe.html external-link-new-window>Recipe for a hurricane
- Nasa, Earth Observatory, <link http: earthobservatory.nasa.gov naturalhazards external-link-new-window>Cyclone Nargis
- Noaa/AOML Altimetry Products, <link http: www.aoml.noaa.gov cgi-bin trinanes external-link-new-window>several maps for the 1st May 2008 during the Cyclone Nargis in Indian Ocean (sea level anomalies, sea surface temperature, depth of the 26°C isotherm , hurricane heat potential).