News
Hurricane Florence and Typhoon Mangkhut
In September 2018, the hurricane Florence crossed the Atlantic Ocean and hits the US coasts. At the same time, the typhoon Mangkhut, in the Pacific ocean, hits the Chinese coasts. Illustrations from the satellite Sentinel-3A data with the waves height at the passage of these storms.

Satellite altimetry data from Sentinel-3A measured the Significant Wave Heights during the passage of these storms (see Figure 1 below):
- more than 5 m at 10-25 km off the North and South Carolina coasts on 13 and 14 September (respectively for the ground tracks 678 and 691) while the hurricane Florence crossed this area. A peak at almost 7m was measured on 13 Sept. at ~70 km off the coasts.
- more than 10 m at only 16 km off the Hong-Kong coasts was measured on 15-16 September (respectively for the ground tracks 733 and 748).
The SAR on the Sentinel-1B satellite provided wind fields while the super typhoon Mangkhut was heading towards southeast Asia with a maximum wind speed reaching 288 km/h on 11 September (see Figure 2 at the bottom).
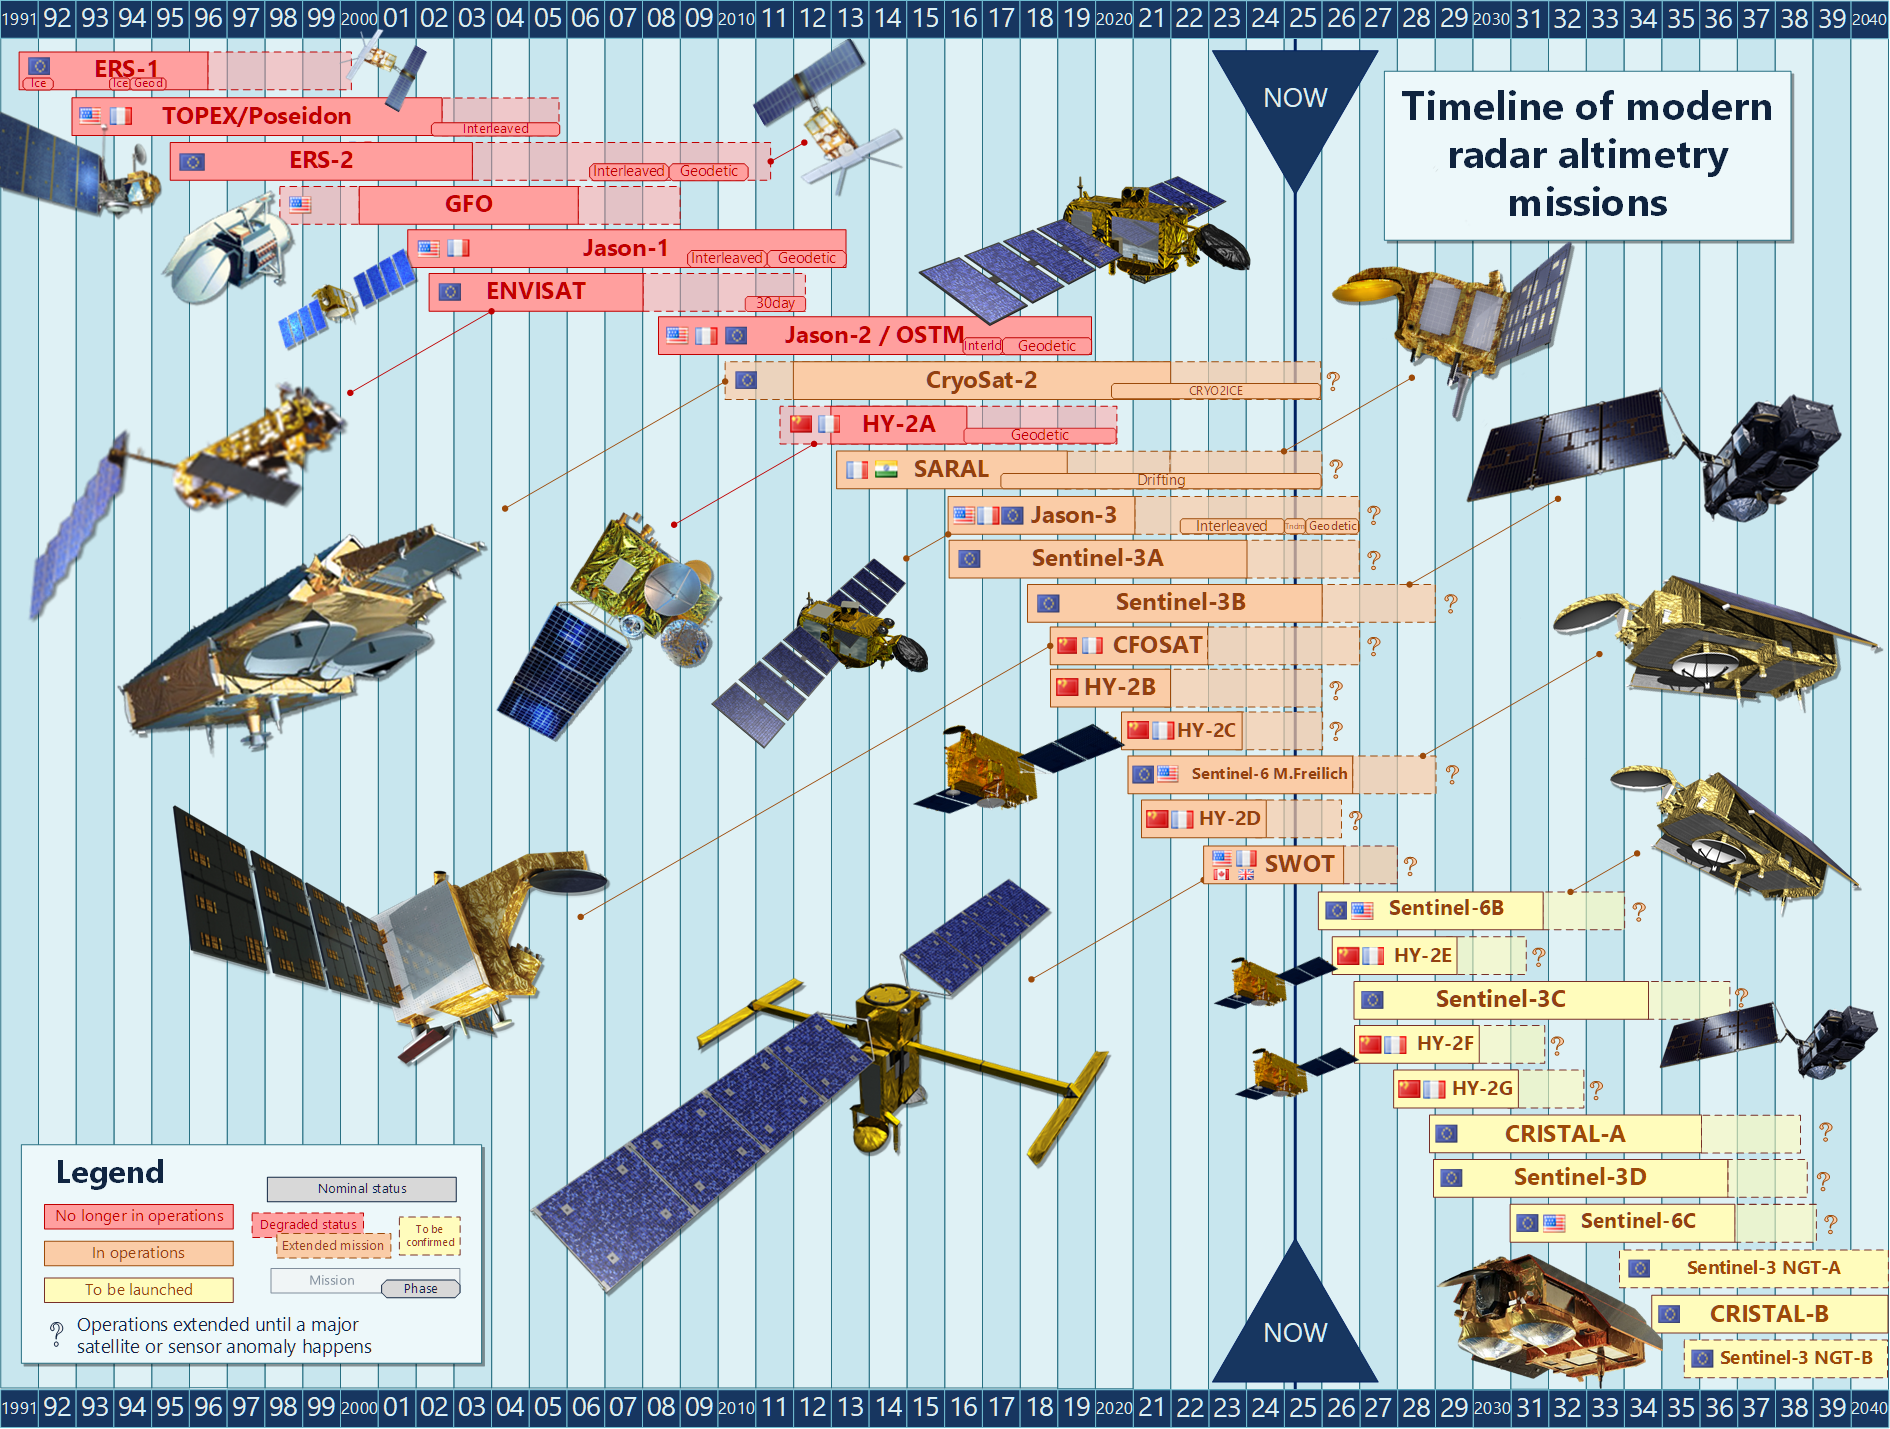
The upcoming launch of the Chinese-French CFOSAT satellite scheduled on 2018/10/29 will allow accurate ocean forecasts during such extreme events by collecting data both on wind speed and wave height.
<link file:23891> | <link file:23892> |
<link file:23887> | <link file:23893> |
Fig. 1 : Significant Wave Heights (H1/3, in meters) measured along-track by Sentinel-3A during hurricane Florence (left) and typhoon Mangkhut (right), during the passage of the storms, on September 2018. The maps plots all the tracks between 10-14 Sept. for Florence and 15-17 Sept. for Mangkhut. The plots at the bottom only show the SWH nearest the passage of the storms off the coasts (x-axis indicates the distance to the coast in km for each track). Credits EU Copernicus Marine Service for the data, produced by AVISO+. | |
<link file:23897> | |
Fig.2: Ocean surface wind speed map measured by Sentinel-1B on 2018/0911 while the typhoon Magkhut was in Category 5. Maximum wind speed reached more than 80m/s (288km/h). The ocean fields are given by the Sentinel-1 SAR on its Extended Wide Swath mode. The swath about 400 km-width are visible on the map. Credits Sentinel-1B: Contains modified Copernicus Sentinel data 2018 processed by IFREMER/CLS. |
Further information
- CFOSAT
- page <link internal-link>Missions
- <link https: www.youtube.com _blank external-link-new-window>video presentation of the CFOSAT project (posted by CNES)
- on Copernicus Marine Service website: <link http: marine.copernicus.eu hurricane-florence-wave-height _blank external-link-new-window>Looking at hurricane Florence through wave height with model data.
- Data access:
- <link http: marine.copernicus.eu services-portfolio access-to-products _blank external-link-new-window>Significant wave heigths from Sentinel-3A, European Copernicus Marine Service


