


News
The Japan tsunami observed by altimeters
On March 11 2011, the 9.0-magnitude earthquake at 80 miles eastern of Honshu, Japan, generated a tsunami. The front wave crossed the Pacific Ocean within 24 hours and has been observed by the altimeters.
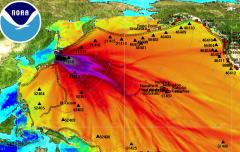
This is the forecast of the maximum wave amplitude and time of propagation computed by the MOST model (credits NOAA/PMEL/Center For Tsunami Research). The wave has crossed the Ocean in 24 hours and 3 satellites have flown over it.
Altimeters have been designed to observe the sea level variability. Tsunami waves are physical signals which can be seen with altimetry although the probability is weak. The Indian Ocean tsunami in December 2004 and the Chile tsunami in February 2010 have been observed (Ablain et al., 2006 and Legeais et al., 2010). In the case of the Japan tsunami, Envisat, Jason-1 and Jason-2 altimeters have observed the front wave. Two examples are given here: for Envisat, the data is located in the western tropical Pacific Ocean 5 hours and 25 mn after the earthquake. A 50 cm wave amplitude is measured. For Jason-1, the data is located in the middle of the North Pacific Ocean 7 hours and 45 mn after the earthquake. The amplitude of the wave is as large as 60 cm.
<link fileadmin images news mod_actus tsunami_japon_enn_c100_t419.png download>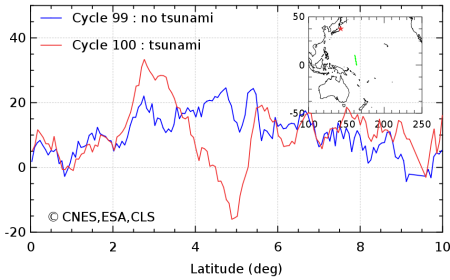 |
|---|
<link fileadmin images news mod_actus tsunami_japon_j1_c338_t147.png download>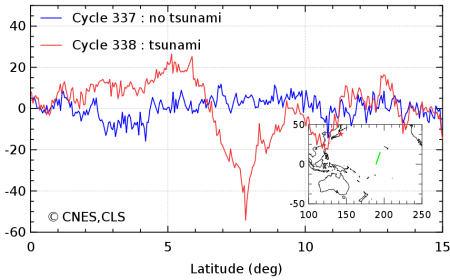 |
IGDR Sea level anomalies seen by Envisat (cycle 100, pass 419) (top) and Jason-1 (cycle 338, pass 147) (bottom). The sea level anomalies observed in the previous cycles are plotted in blue as a comparison (only the sea level variability is observed). Credits CNES,ESA,CLS.
Note that altimetry is not and will never be a tool for detection and warning of tsunamis. The altimeters can only observe the phenomenon after its generation. Apart from the time needed to process the data, some conditions are necessary to observe the tsunami: the front wave needs to be strong enough to be distinguishable among the ocean variability and the satellites must have flown over the phenomenon some hours after the earthquake before the wave has vanished or has reached the coast. The unique contribution of satellite altimetry <link http: www.aviso.oceanobs.com en altimetry principle glossary>is to better understand and improve the modelling of tsunami propagation and dissipation.
Further information:
- Altimetry applications in videos: <link http: www.aviso.oceanobs.com en news-storage news-detail _top external-link-new-window>Tsunamis.
- Ablain, M., J. Dorandeu, P-Y. Le Traon, A. Sladen, The Indian Ocean Tsunami of December 26, 2004, High Resolution Altimetry Reveals New Characteristics of the December 2004 Indian Ocean Tsunami, Geophys. Res. Lett., 33 (21), 2006.
- Ablain, M., J. Dorandeu, P-Y. Le Traon, A. Sladen, <link http: earth.esa.int cgi-bin _blank external-link-new-window>The Indian Ocean Tsunami of December 26, 2004, Observed by Multi-satellite Altimetry, 15 years of progress in radar altimetry Symposium, Venice, Italy, 2006.
- Smith, W.H.F., R. Scharroo, V.V. Titov, D. Arcas, and B.K. Arbic, Satellite altimeters measure tsunami. Oceanography, 18(2), 11-13, 2005.
- Okal, E., A. Piatanesi, and P. Heinrich, Tsunami detection by satellite altimetry. J. Geophys. Res. 104 (B1), 1999.
- A brochure about tsunamis : <link http: ioc3.unesco.org itic _blank external-link-new-window>Tsunami, the great waves, written by the International Tsunami Information Center (ITIC).
- Legeais, J.-F., M. Ablain, E. Sanz, E. Bronner, N. Picot, Tsunami observations by satellite altimeters, presentation at OSTST 2010 (<link fileadmin documents ostst oral tuesday_afternoon legeais.pdf download>pdf)
- Noaa: <link http: nctr.pmel.noaa.gov honshu20110311 _blank external-link-new-window>Center For Tsunami Research
- CEA: <link http: www.cea.fr defense seismes_et_tsunamis3 _blank external-link-new-window>Seismes et tsunamis