


Typhoon Haiyan seen by Saral
Image of the Month - November 2013
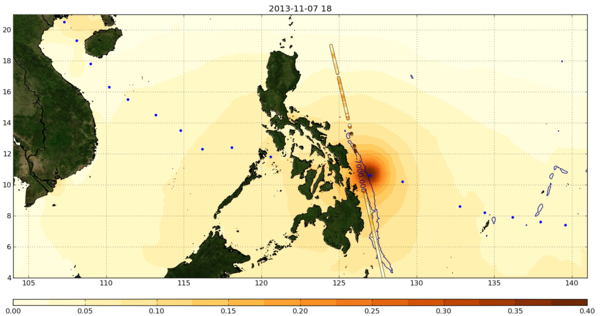
Pass 821 of Saral/AltiKa altimeter flying over Haiyan superimposed on MOG-2D combined sea level on 2013-11-07 at 18:00 UTC (in meters). The trajectory of the Typhoon is superimposed with blue circles. If you click on the image, you will see an animation of the MOG-2D combined sea level between 2013-11-06 at 00:00 UTC and 2013-11-10 at 18:00 UTC. The path of the typhoon is indicated by circles giving the category of the cyclone corresponding to the Saffir-Simpson scale. We clearly see the oceanic bump due to the extreme forcing. The model elevation seems weaker than in situ observations of the cyclone: this may be explained by the model errors, and particularly the atmospheric forcing, the bathymetry, .... Credits CNES/CLS.
Typhoon Haiyan is one of the most powerful typhoon devastating the Philippines. It reached the coast on November 7. Altimeters have been designed to observe the sea level variability at global scale. Due to the specific spatial/time samplings of altimeters, the probability to fly over extreme events is low, and when it happens the data are often edited because most of flags are designed for normal sea state conditions. However, sometimes the satellite manages to observe ocean variability in the case of strong cyclones. In the case of Haiyan, Saral/AltiKa overflew the typhoon on pass 821 on November 7 21:30 UTC.
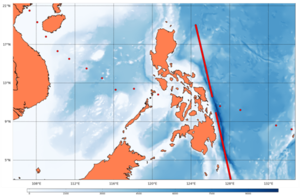
The satellite track is localized in a deep ocean region and overfly a very deep and narrow underwater pit localized next to the continental shelf edge.
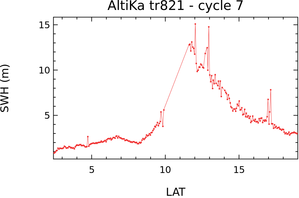
If looking at the 1Hz measurements, we notice a large gap (between latitudes 10.2 and 11.5 degrees) on the typhoon location (in its extreme part), but in the northern part of the cyclone we get data with the wave heights (Significant Wave Height: SWH) reaching up to 13 meters.
We have also looked at Saral/Altika 40 Hz measurements over the typhoon, thanks to PEACHI prototype. As expected, we clearly see that 40 Hz data are noisier than 1 Hz. The large gap over the center of the Typhoon is still visible for HF (high frequency) data indicating that the altimeter could not manage to do any measurement in this area. In the southern and the northern parts of the track, localized on the Typhoon edge, we observe that HF data are more numerous (both SIGMA0 and SLA are shown); although some values are clearly erroneous, it seems that a lot of measurements could be retrieved using the HF dataset during the cyclone. Some specific processing would be needed to clean the HF data.
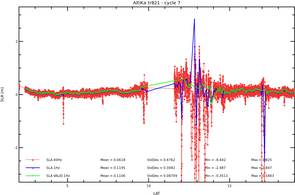
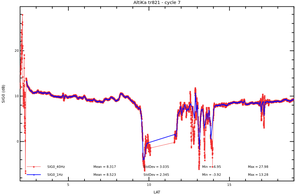
Measurements of Saral/AltiKa for pass 821 of left: Sea Level Anomalies (SLA) at 40 Hz (red), SLA at 1 Hz (blue) and SLA at 1 Hz with normal conditions validation (green) in meters. right: Sigma-0 at 40 Hz (red) and at 1 Hz (blue) in dB. Click to enlarge. Credits CNES/CLS.
See also:
- Image of the Month, August 2013: 20 years of typhoons
- Applications: Marine meteorology and atmospheric studies
- Applications: Hurricane Katrina intensification
Websites on this subject:
References:
- Publication: Carrère et al., 2009: "Observing and Studying Extreme Low Pressure Events with Altimetry"
- Newsletter Aviso : Using satellite altimetry to identify regions of hurricane intensification, G. Goni et al., Aviso Newsletter 9
News
 Archives .
- Aviso Newsletter .
- Search.
- Front-page news.
- Image of the month .
- 2026 .
- 2025 .
- 2024 .
- 2023 .
- 2022 .
- 2021 .
- 2020 .
- 2019 .
- 2018 .
- 2017 .
- 2016 .
- 2015 .
- 2014 .
- 2013 .
- Dec. 2013: Mediterranean tides on the move.
- Nov. 2013: Typhoon Haiyan seen by Saral.
- Oct. 2013: Salt and temperature vs altimetry.
- Sep. 2013: Icebergs on the move.
- Aug. 2013: 20 years of typhoons.
- Jul. 2013: Ob bogs and wetlands.
- Jun. 2013: Is the ground rising or the sea decreasing?.
- May 2013: Drifting buoy.
- Apr. 2013: Surface currents, a pinch of winds with altimetry.
- Mar. 2013: Saral: 6 days old, and already measuring.
- Feb. 2013: Alboran Sea eddies.
- Jan. 2013: Salinity gets finer with altimetry.
- 2012 .
- 2011 .
- 2010 .
- 2009 .
- 2008 .
- 2007 .
- 2006 .
- 2005 .
- 2004 .
- 2003 .
- 2002 .
- 2001 .
- 2000 .
- 1999 .
- 1998 .
- Operational news and status .