


Salts and temperature vs altimetry
Image of the Month - October 2013
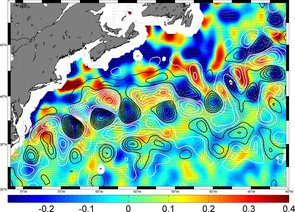
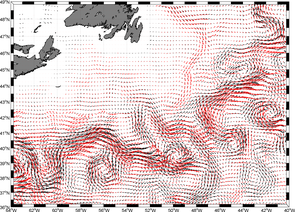
Left, surface density anomalies (in kg/m3) computed every 10 days at a resolution of 0.25° from SMOS salinity and GHRSST sea surface temperature data (filtered for spatial scales over 500 km) in August 2012. Overlaid are sea level anomalies from altimetry (white = positive SLAs, black = negative SLAs). Right, geostrophic currents computed from this density (red) and from altimetry (black). In both cases, they compare well. (Credits Ifremer)
Ocean surface heights measured by altimetry reflect the density of the waters. However, ocean water density variations are a matter of the quantity of dissolved salts (i.e. salinity) and temperature. Thus, using SMOS satellite surface salinity and sea surface temperature, a surface density can be computed, and compared with altimetry sea surface heights. Moreover, with those densities, surface geostrophic currents can also be derived, similarly to what is done with heights.
The comparison proves that the data are of good quality. Such studies also bring their own piece to the understanding of the ocean, in particular for the Gulf Stream region, the knowlegdge of the mixing between warm/salted eddies from the Sargasso sea and the cold/fresh water ones coming from the Labrador current. SMOS also have a resolution of about 40 km every 3 days, and is not saturated in Summer like the surface temperature.
Mixing all available measurements enable to better understand the ocean, its variations and its impact on climate.
See also:
- Image of the Month, January 2013, Salinity gets finer with altimetry
- Applications: ocean mesoscale circulation
- Application: ocean large-scale circulation/ major currents - Gulf Stream
- Data: Ssalto/Duacs near-real and delayed time multimission altimeter products
Other websites on this subject:
News
 Archives .
- Aviso Newsletter .
- Search.
- Front-page news.
- Image of the month .
- 2026 .
- 2025 .
- 2024 .
- 2023 .
- 2022 .
- 2021 .
- 2020 .
- 2019 .
- 2018 .
- 2017 .
- 2016 .
- 2015 .
- 2014 .
- 2013 .
- Dec. 2013: Mediterranean tides on the move.
- Nov. 2013: Typhoon Haiyan seen by Saral.
- Oct. 2013: Salt and temperature vs altimetry.
- Sep. 2013: Icebergs on the move.
- Aug. 2013: 20 years of typhoons.
- Jul. 2013: Ob bogs and wetlands.
- Jun. 2013: Is the ground rising or the sea decreasing?.
- May 2013: Drifting buoy.
- Apr. 2013: Surface currents, a pinch of winds with altimetry.
- Mar. 2013: Saral: 6 days old, and already measuring.
- Feb. 2013: Alboran Sea eddies.
- Jan. 2013: Salinity gets finer with altimetry.
- 2012 .
- 2011 .
- 2010 .
- 2009 .
- 2008 .
- 2007 .
- 2006 .
- 2005 .
- 2004 .
- 2003 .
- 2002 .
- 2001 .
- 2000 .
- 1999 .
- 1998 .
- Operational news and status .